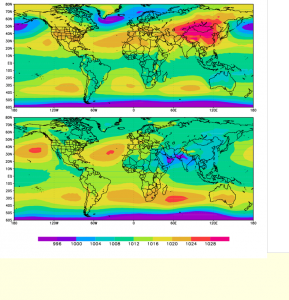
The atmospheric Centers of Action (COA) are persistent regions of high and low pressure centered over specific parts of the globe. As first introduced by Rossby et al. (1939), these broad systems can clearly be seen in monthly-averaged sea level pressure maps (as seen in the Figure 1., below).
Figure 1. Global sea level pressure (Pa) distribution 1980-2000.
Top: DJF average. The Aleutian Low and the Icelandic Low are clearly seen at high northern latitude, together with the Hawaiian High the Azores High, in the northern subtropics. In the southern hemisphere we can see the South Pacific High, the South Atlantic High and the Indian Ocean High. In addition the Siberia High, located over the Asian landmass, is prominently visible.
Bottom: JJA average. The Icelandic Low and the Aleutian are weaker than in winter while the Azores High and the Hawaiian High are stronger and displaced from their winter locations. The Indian Ocean High and the south Atlantic High have become stronger. A Low pressure system ( the South Asia Low) is seen in the Arabia-India region.
However, while semi-permanent in terms of climatology, these COA’s move and fluctuate from month-to-month and year-to-year. This variability can have a number of significant impacts on regional climate. For example, a change in a COA’s position or intensity can affect seasonal rainfall patterns by altering the mean advection of moisture (Gamble et al., 2008; Li et al., 2011; Hameed and Riemer, 2012) and the tracks of tropical cyclones (Kasahara, 1959). The Azores High over the North Atlantic has also been shown to strongly impact the Gulf Stream north wall (Hameed and Piontkovski, 2004) and the transportation of Saharan mineral dust (Riemer et al., 2006).
It is thus important to quantify this variability, which starts with defining an objective set of indices representing the position and intensity of these COA’s. One such set was used by Hameed and Piontkovski (2004), in which the COA’s latitude I_ϕ and longitude I_λ are weighted by sea level pressure. More specifically, the position is given by an area-averaged departure in mean sea level pressure P_ij from a prescribed threshold value P_t over a gridded domain (I,J):
where Φij and λij are the latitude and longitude of each grid point respectively. M = 0 for high pressure centers and M = 1 for low pressure centers. δij = 0 wherever (Pij – P_t)(-1)^M < 0, and δij = 1 wherever (Pij – P_t)(-1)^M > 0 . When identifying High centers, this process eliminates all points possibly associated with adjacent Low pressure centers, and vice versa for identifying Low centers. The cosine function accounts for the decrease grid box area with increasing latitude toward the poles. The area-weighted intensity index I_p of the COA is calculated in the same manner.
The domains and threshold pressures for each of the identified COA’s are given in the table below.
| COA | P_t | Domain Latitude | Domain Longitude |
| Icelandic Low | 1014 hPa | 40oN-75oN | 90oW-20oE |
| Azores High | 1014 hPa | 20oN-50oN | 70oW-10oE |
| Aleutian Low | 1013 hPa | 35oN-70oN | 130oE-120oW |
| Hawaiian High | 1013 hPa | 20oN-50oN | 140oE-100oW |
| Siberia High | 1015 hPa | 25oN-70oN | 50oE-170oE |
| South Atlantic High | 1016 hPa | 10oS-45oS | 50oW-10oE |
| South Pacific High | 1016 hPa | 10oS-45oS | 160Eo-70oW |
| Indian Ocean High | 1016 hPa | 10oS-45oS | 40oE-120oE |
| South Asia Low | 1013 hPa | 10oN-35oN | 35oE-95oE |
The monthly indices for each of these COAs are archived in the links at the top of the webpage. All indices use the monthly sea level pressure of the National Center for Environmental Prediction (NCEP) reanalysis (Kalnay et al., 1996). When using these indices, please cite the paper by Hameed and Piontkovski (2004) listed among the references below.
References:
Gamble, D. W., and D. B. Parnell, S. Curtis, (2008): Spatial variability of the Caribbean mid-summer drought and relation to north Atlantic high circulation. Int. J. Climatol. 28, 343-350.
Hameed, S., and S. Piontkovski, 2004: The Dominant Influences of the Icelandic Low on the Position of the Gulf Stream Northwall. Geo. Res. Lett., 31, 1-4. doi: 10.1029/2004GL019561
Hameed, S., and N. Reimer, 2012: Relationship of Sahel Precipitation and Atmospheric Centers of Action. Adv. Meteorol., 2012, 1-8. doi: 10.1155/2012/953853.
Kalnay, E. et al., 1996: The NCEP/NCAR 40-Year Reanalysis Project. Bull. Amer. Meteor. Soc., 77, 437–471. doi: http://dx.doi.org/10.1175/1520-0477(1996)077<0437:TNYRP>2.0.CO;2
Kasahara, A., 1959: A Comparison between Geostrophic and Non-geostrophic Numerical Forecasts of Hurricane Movement with the Barotropic Steering Model. J. Meteorol. 16, 371-384.
Li, W., L. Li, R. Fu, Y. Deng, and H. Wang, 2011: Changes to the North Atlantic Subtropical high and its Role in the Intensification of Summer Rainfall Variability in the Southeastern United States. J. Clim. 24, 1499-1506.
Riemer R., O. M. Doherty, and S. Hameed, 2006: On the variability of African dust transport across the Atlantic. Geophys. Res. Lett., 33, L13814.
Rossby, C.-G., 1939: Relation between Variations in the Intensity of the Zonal Circulation of the Atmosphere and the Displacement of the Semipermanent Centers of Actions. J. Mar. Res., 2, 38–55.


