
Real-Time Data
In addition to the delayed-mode SeaCat data, meteorological data are being collected from the south tower of the Smith Point bridge and these data are available in real time below. That data includes temperature and salinity from the Smith Point SeaCat, short and long wave radiation from Eppley pyronometers, and wind speed, wind direction, air temperature, humidity, barometric pressure and rainfall rate from a Vaisala WXT520.
On October 6th, 2010 we deployed GSB #1 buoy south of Sayville at 40o 41.6’N, 73o 05.1’W. This buoy reports wind speed and direction, air temperature and humidity, photosynthetically active radiation (PAR), water temperature and salinity, chlorophyll-a fluorescence and turbidity. On December 29, 2010 ice forming in the Bay carried the buoy quite a ways as the ice sheets broke up and started to move around. The ice finally released the buoy south of Islip in mid-February at which time we towed the buoy to the West Sayville Marina on February 17th. After checking on the systems and repainting, the buoy was towed out and re-anchored near its original location, 40 41.552 N, 73 5.144 W, on March 23, 2011. The winter of 2011-2012 was particularly mild and we did not have any trouble with ice flows but significant ice build up in January 2013 captured the buoy again and dragged it first south and then some two miles west. It will be returned to its proper location as soon as possible.
Real-Time Data and Plots
Smith Point Bridge
Plot of Bellport data for the past 60 days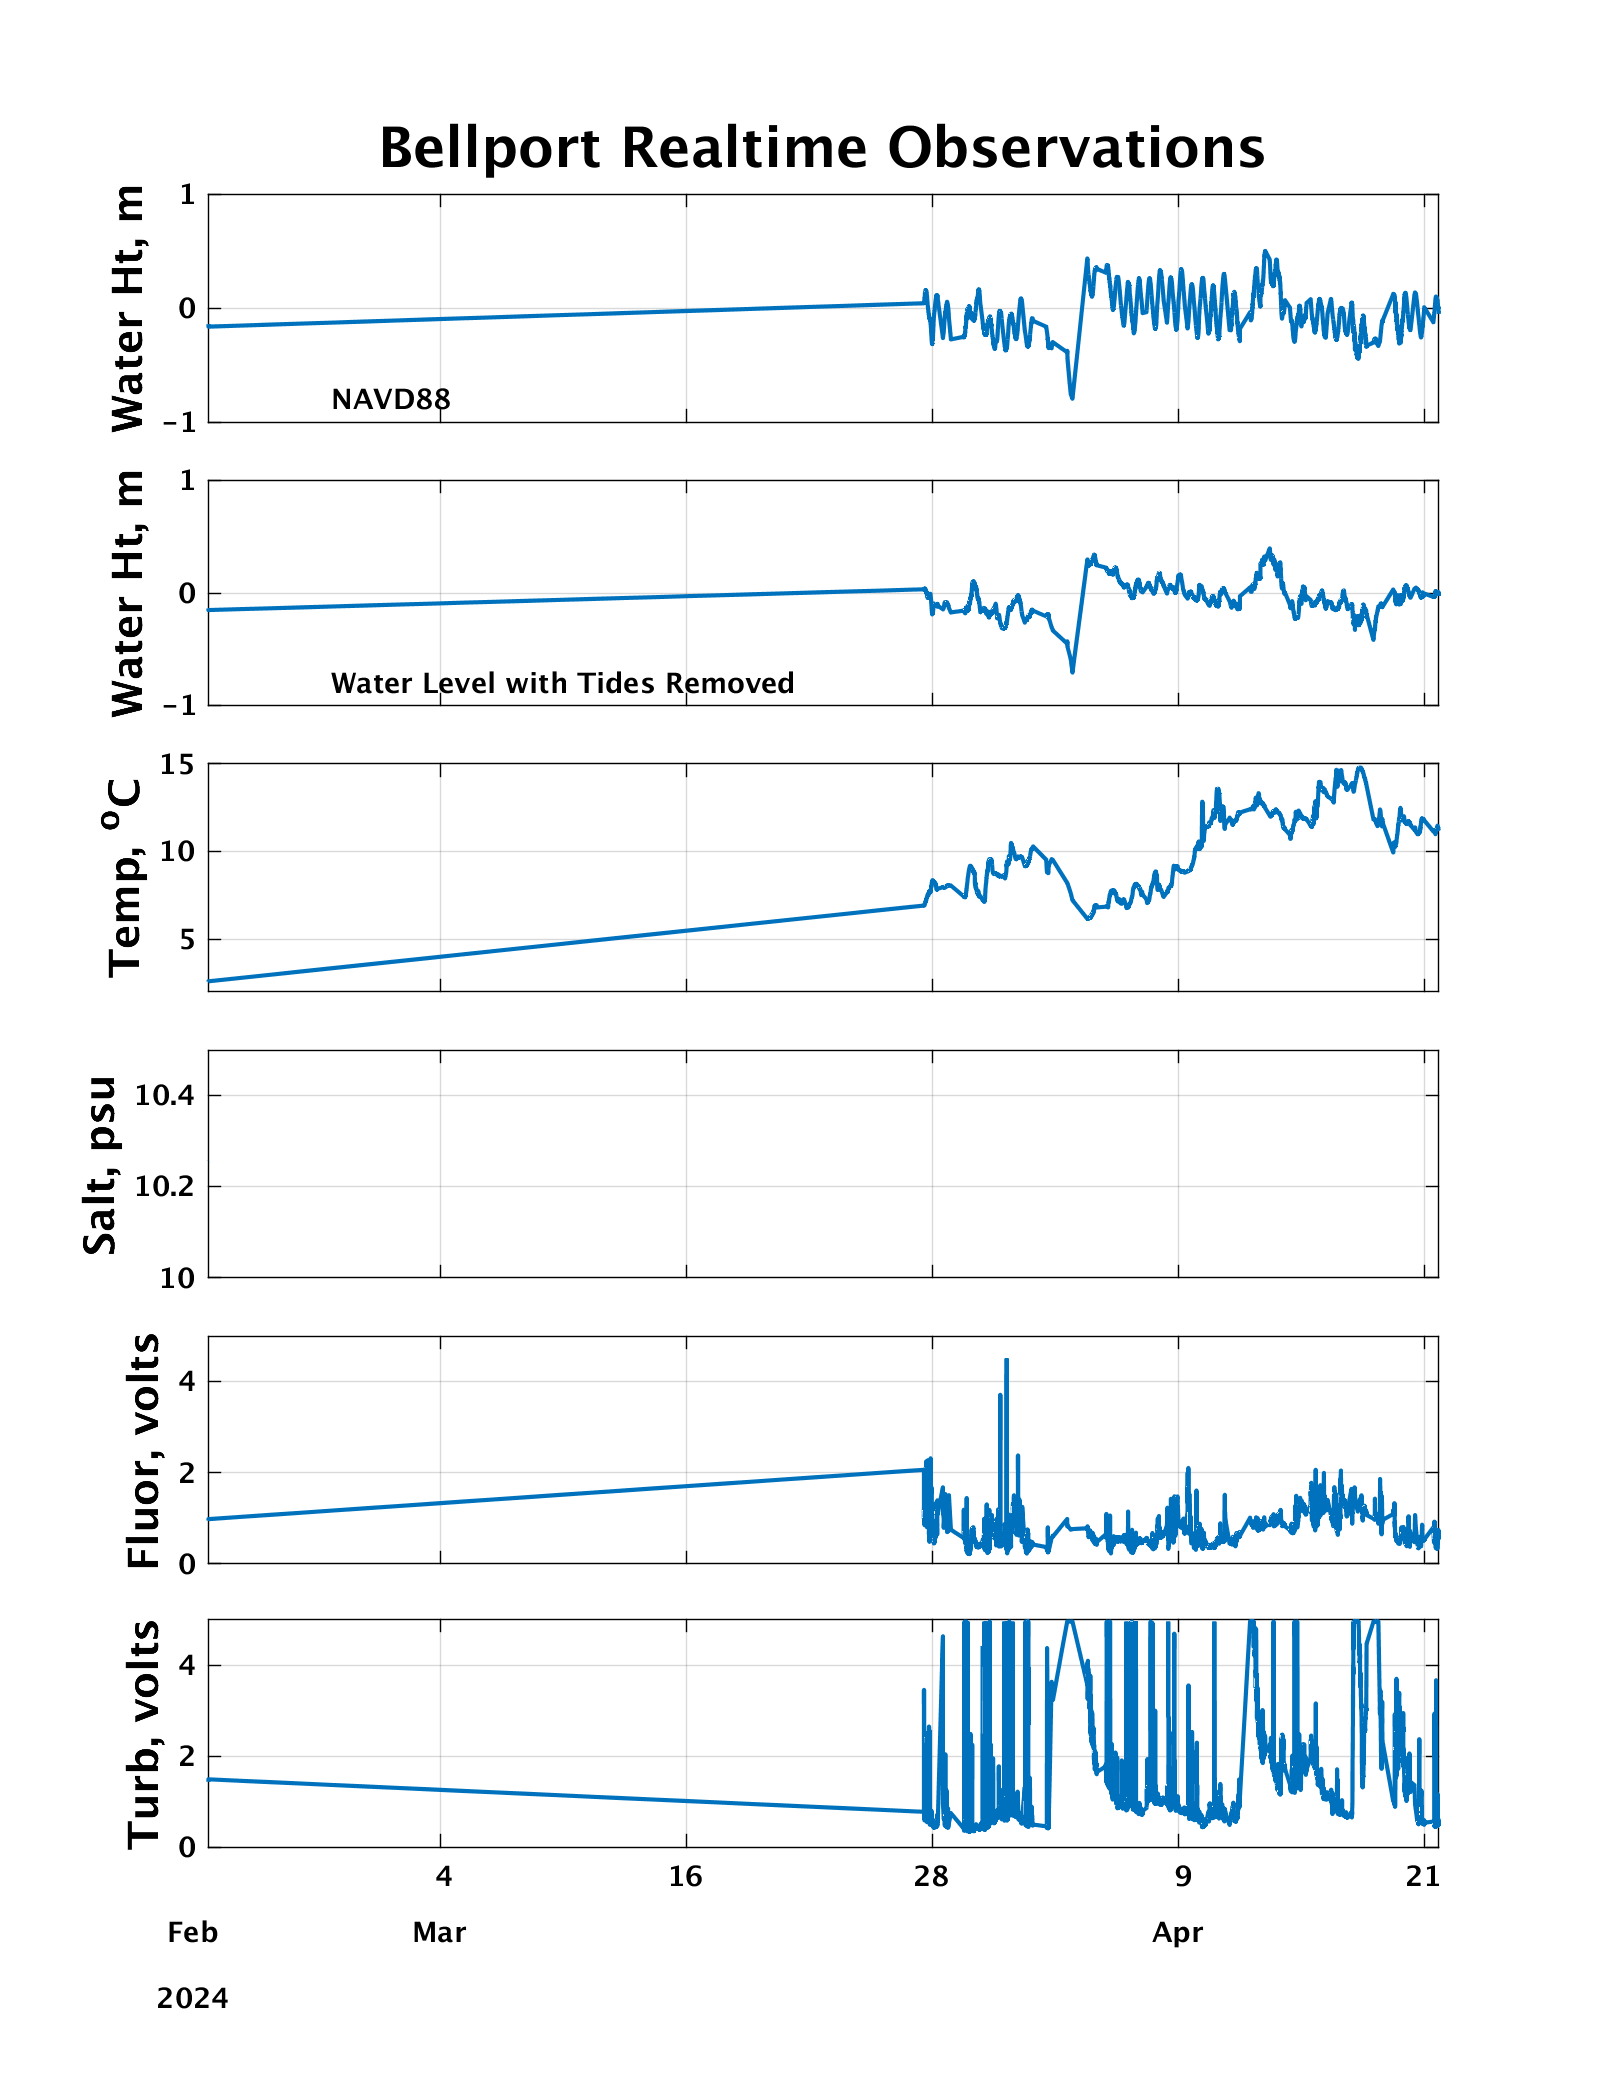
Recent averaged data file
BPRT_2013 data
BPRT_2014 data
BPRT_2015 data
BPRT_2016 data
BPRT_Recent
Current Precipitation Map
A map of the United States showing precipitation.
NDBO Buoy 44025
Shows a 3-meter discus buoy South of Long Island.
Islip Airport Weather
Brookhaven Airport Weather
Local Towns Weather
Gives basic weather information for seven towns around Long Island.
OceanWeather.COM
Click on the Current Marine Data and the corresponding area to see wave height and wind data over the oceans.