
CLIMATE CHANGE – AN INTRODUCTION
WHAT IS CLIMATE?
Nothing in the ocean can be discussed without including the effects of climate change.
But what is climate? And what do we really mean by climate change?
Climate has properties, including temperature, wind conditions, other atmospheric conditions (temperature, humidity), ocean circulation.
Climate is not the totality of these properties every moment, but a characteristic set of values of these properties over a period of years. There is not a specific time period that is universally accepted but let us use 30 years as a number, which is accepted by the IPCC. So,
Definition: climate change is a directional change in climate conditions, which are temperature conditions and weather patterns that persist in a region for at least thirty years.
Therefore, Climate change has a definition that must include the time scale of the characterization of climate.
Now that we have this definition, we define climate change as a persistent directional change over a period of years greater than the window of 30 years we have defined.
DEFINING OSCILLATIONS
Not all climate variation is climate change. We know of a series of conditions where oscillations occur. The simplest are seasonal changes, which occur with a scale of a year (e.g., winter versus summer). But these are not climate as we define change well over the scale of one year. But a large number of changes occur over several years from one general state to another. These are known as climate oscillations. The most famous is the El Nino-La Nina oscillation. These are as important in the run of decades as global warming and interact in complex ways with the larger climate warming trend. One example are El Nino events, which add warmth to an already warming ocean, causing peaks of thermal stress. See section below on oscillations.
CLIMATE IS A RESULT OF THE COMBINATION OF CLIMATE CHANGE AND OSCILLATIONS
We will expand on this, but the world climate involves longer-term change interacting with oscillations in climate. In order to see oscillations, you may have to detrend longer-term climate change to see oscillations. We discuss this below.
GLOBAL WARMING: A MAJOR FEATURE OF CURRENT CLIMATE CHANGE
Let’s jump into the subject. The earth’s climate change over the past couple of hundred years has involved warming. Here is a convenient indicator of the components of warming that have been observed on the planet, although variably in different locations and in different local environmental contexts (source: NOAA).

You can see from this diagram how interactive warming can be. Ocean temperature is rising. That leads to the expansion of ocean volume, and therefore to sea-level rise. But glaciers are also melting, including mountain glaciers, e.g., the ice cover of continental masses such as Antarctica and Greenland, which also can lead to sea level rise, along with loss of glacial ice cover, and rearrangements of water supplies from ice-covered regions to lower regions. The temperature of surface oceans is steadily increasing, but this is uneven throughout the world. The Indian Ocean is increasing faster than other oceans, for example. Some local areas have great rates of sea level rise, partially because regional coastal sinking is also occurring, as in coastal Virginia.
What is the time scale of this current climate change involving increasing temperature? Well, we have to use lots of historical indicators to understand this. Climate scientist Michael Mann and colleagues amassed data from a wide variety of indicators of temperature, including isotopic data, tree ring growth rates, and much more. Here, in a graph, is the startling summary of what they found:

Climate change based on data collected by Michael Mann and colleagues. Source for figure: The Atlantic.
But for original analysis, read: Mann et al. 2008 Proc. Nat. Acad. Sci. https://doi.org/10.1073/pnas.0805721105
It’s easy to see, there is no long-term trend from the year 1000-1850. Then temperature accelerates. After 1900 we have ample data to show the acceleration of warming. We know from other data that climate has changed greatly over the past few hundred million years. At times the earth was mostly tropical. At others, glaciers covered the earth. But since the year 1000, global temperature was overall constant until it greatly accelerated since around 1900.
We have much more useful data. A paper by James Hanson and colleagues published in the Proceedings of the National Academy of Sciences show much of the detail of warming throughout the globe on land and sea since 1880.

Source: Hanson, et al. 2006, PNAS. https://doi.org/10.1073/pnas.0606291103
Important note: temperature in most climate change graphs are reported as a deviation from a long-term average value, which is why the values in most climate change graphs are plus or minus a few degrees from a zero value.
But there is much much more. A United Nations committee of climate scientists have been updating global data on climate change and have also produced models for the future. For example, see their latest report here. https://www.ipcc.ch/report/ar6/wg2/
The outcome is robust. Our global climate is warming. It is continuing, It will continue. Though the effects are global, you can see from the Hanson et al. map diagram that it is NOT homogenous across the earth, land or sea. Look especially at Alaska and north-central Siberia.
MOST OF THE EARTH’S WARMING IS ENTERING THE OCEAN!
Over 90 percent of this addition of warming is entering the ocean. Here are the data, which is only known from the 1950s. We will return to this below.

BUT WHY IS OUR EARTH WARMING SINCE ABOUT 1900?
Our planet surface is warm, and that is one reason why life thrives on planet Earth. This warmth stems from the “Greenhouse Effect,” an idea credited to Swedish Nobel laureate Svante Arrhenius in 1884. The lower atmosphere contains a series of components, most importantly carbon dioxide, methane, water vapor, nitrous oxide, ozone, and other components that trap incoming solar radiation and reradiate it to the earth’s surface as heat. Okay, it’s more complicated than this but we will use this definition. Owing to the greenhouse effect, we live on a warm planet, supportive of life. The greenhouse effect is good, but its benefits have been altered by human intervention, which has added to the warming effect. In summary, we have burned fossil fuels, which have added greenhouse gases to the atmosphere, which have in turn trapped more heat and added more heat to the earth’s surface and oceans.
HERE IS THE EVIDENCE:
In the nineteenth century, the industrial revolution gave humanity a way to acquire energy efficiently by burning fossil fuels. Over hundreds of millions of years, fossil fuels were stored within the earth as compacted carbon-rich deposits, including coal, gas, and oil. Combustion of fossil fuels has added carbon dioxide and other so-called greenhouse gases to the atmosphere. Measurements by a sensor at the top of Mauna Loa, Hawaii demonstrated the steady increase of CO2 in our atmosphere, changing from 315 ppm in 1958 to over 400 ppm in 2015 (421.7 ppm in September, 2024).

Carbon dioxide measurements from Mauna Loa sensor. Source
It is believed that the atmospheric content was about 280 ppm as the industrial revolution began. Climate scientists believe that the current number (ca 412 ppm) could double in the next 100 years, without any change of action. Climate scientists have concluded that the increase of carbon dioxide and other greenhouse gases is the direct cause of atmospheric warming that has also occurred since the 19th century.
From this general conclusion, we can infer that there are other sources of change in so-called greenhouse gases that affect climate change. Deforestation is also a quantitatively important source of carbon dioxide release. Burning forests will release carbon dioxide into the atmosphere. But retaining forests allows a net absorption of carbon dioxide, owing to forest photosynthesis. Therefore conservation of major forests, such as the Amazon tropical rainforest, can help ameliorate global climate change. Cloud cover can also be important, but this factor is highly variable over time and space. Aerosols also can have a strong effect on climate, but the results can vary. Aerosols in the atmosphere could reduce solar heating, but other aerosols could consist of particles settling on snow, causing heat absorption and ice melting.
WARMING OF SEAWATER
The warming of the atmosphere also results in the warming of seawater. Some of these effects are direct, as a warm atmosphere warms the upper ocean layers. As a result, shallow water embayments and estuaries throughout the world have been shown to be warming, although data collection has been very uneven. Still, temperature records show warming in widespread coastal bodies of water. As an example, the Hudson River estuary can be shown to have been warming steadily since the 1940s. Similar data are available for many estuaries throughout the world. Large coastal bodies of water also are known to be warming, such as the Gulf of Maine.

Source: Seekell and Pace 2011 J. Env. Monitoring

Source: Phys.org

Sea surface temperature 1959-2019, southern Baltic Sea (mean temperature with minimum-maximum). Note the great variation around the means. Source: Zalewska, et al. 2024. Oceanologia v. 66, pp. 37-55. https://doi.org/10.1016/j.oceano.2023.08.001
This pattern extends to nearly the entire ocean. Hardly a place in the surface ocean has been spared.

Source: NASA
One can immediately see that the change is not uniform. The Arctic is clearly being greatly affected. Sea ice used to cover the Arctic Ocean nearly all year round completely. Now, most of the Arctic Ocean is melted in summer. February 2025 brought us a record low for area of polar ice cover. The Arctic Ocean is warming much faster than most other ocean regions. The exchange of seawater with lower-latitude ocean water is a major cause of this increased warming. This exchange has been measured with radionuclide tracers.

Change in Arctic Sea Ice 1984-2012
SEA SURFACE TEMPERATURES ARE AT A RECORD HIGH FOR 2023

The temperature rise continues into 2024-5. El Nino has subsided but high ocean temperatures continued into 2024.

DIRECT MAJOR EFFECTS OF TEMPERATURE ON MARINE ORGANISMS AND COMMUNITIES
Most marine species have thermal limits. There is enough data on thermal limits of marine species to calculate thermal safety margins, if we use accepted models of ocean temperature change in the future. A study by Pinsky et al. (2019, Nature) demonstrated that marine species overall have more vulnerability to warming than terrestrial species, despite the intuition that water must be less volatile to climate change than air. There is a crucial feature of the coastal ocean: the world has many coasts that are north-south trending and therefore extend over great ranges of latitude. There is a strong latitudinal gradient. Therefore: many species have low latitude limits that are warmer than their respective high latitude limits. We can make some generalizations about warming effects in a geographic context:
The rule of latitude shifts: Global ocean warming should cause extinctions at the warming low latitude limit, and should also cause extensions toward the warming cold latitude limit.
So far, it has been easy to see shifts of high latitude geographic limits of species. As warming occurs, species at their low latitude geographic limit will tend to be adapted to cooler climates and the low latitude limit will be truncated because of thermal-related death, or species will suffer environmental stress from higher temperatures. In the 1990s warming affected the American lobster Homarus americanus, and populations near the southern limit experienced heat-related disease and abundance plummeted (see Wahle et al. 2009, Marine Ecology Progress Series). But northern populations in the Gulf of St. Lawrence in Canada expanded. Populations in Maine also increased but they are expected to decrease from heat stress in a couple of decades. So, as warming occurs in high latitudes, coastal species can shift their range to higher latitudes, assuming they can disperse easily, which is especially the case for species with planktonic larvae. On the east coast, the southern extent of the mussel Mytilus edulis has been truncated, as warming has exceeded its thermal limits (Jones et al. 2009). On both the east and west coasts of North America, different fiddler crab species have extended their range to higher latitudes (e.g., Minuca pugnax, see Johnson 2014). In the northeast Atlantic, several important fishery species, such as cod, have extended to Arctic waters and have left more southerly latitudes.

The effects of coastal ocean warming on the geographic ranges of coastal species. As warming occurs, the geographic range is truncated at the low latitude limit, owing to heat stress. But the range also may expand to higher latitudes as warming occurs (J. Levinton, 2023).
For seafood, climate change has caused a movable feast! Seafood is shifting to higher latitudes, or disappearing. In 2022 the snow crab has nearly disappeared from the northern reaches of the Pacific, the Bering Sea, which is a catastrophe for the fishing industry. Was this caused by warming from climate change? We do not know. But warming has caused or strongly influenced the loss of the lobster (Wahle et al. 2015 https://doi.org/10.1093/icesjms/fsv093) and bay scallop fisheries (Tomasetti et al. 2022 DOI: 10.1111/gcb.16575) in southern New England USA waters. Ocean warming also is accompanied by a reduction of dissolved oxygen. Combined with human reductions of coastal dissolved oxygen, warming will have more catastrophic impacts on fisheries in the future.
Paradigm of catastrophic limits. Some entire communities are facing thermal catastrophe because they are trapped in an already thermally extreme environment. Some species and whole communities are adapted to tropical habitats and warming often pushes them against a thermal wall. Thermal stress has caused catastrophic changes in a number of marine communities: here are some examples:
Coral Reefs. The most conspicuous potential victims are coral reefs throughout the world. Already, coral reefs in the Caribbean are a shambles. Warming has occurred in pulses in the past 30 years, and thermal stress has combined with disease to nearly eliminate the two dominants of shallow Caribbean reefs, the staghorn and elkhorn corals. Scientists are struggling to try to restore these two species by planting juveniles, but so far disease is winning decisively. Heat waves on the Great Barrier Reef regularly cause a phenomenon known as bleaching, where the crucial symbiotic algae are expelled. Bleaching has been steadily increasing over the decades in eastern Australia. In 2001, Nancy Knowlton warned that coral reefs could become extinct, along with their hyperdiverse associated fauna and flora. Bleaching involves the loss of symbiotic zooxanthellae algae, and recovery is possible. But thermal stress can become extreme enough to kill off corals. This has been a worry in 2023 when El Nino developed and increased already high sea temperatures. But in 2024, thermal stress continues, and coral mortality has become a problem even in the southern Great Barrier Reef, where the drop of El Nino resulted in cooler temperatures. Instead bleaching has increased in early 2024. So has mortality, which is very ominous. In southern Florida, sea water temperatures have been so high that restoration efforts with plantings of juvenile corals have been undermined completely. The Great Barrier Reef in 2024 was experiencing the highest water temperatures in 400 years. The only hope it to try to plant corals in offshore deeper and slightly cooler waters.
Kelp forests, so important to the global ocean economy, are also facing existential danger. Kelps are cool-water species, vulnerable to the warming events so common throughout the ocean. Warming events, so-called marine heat waves, have wreaked havoc on Pacific kelp forests in recent years (e.g., see Rogers-Bennett and Catton 2019). Warming has enabled a massive sea star wasting disease, causing catastrophic declines in over 20 predatory sea star species in the Pacific northwest coast of North America, especially the gigantic sun star (Harvell et al. 2019). This decline has resulted in explosions of grazing sea urchins, which further endanger kelp forests.
Climate Change and Sea Bird Nesting Sites. A dangerous disconnect exists between seabird nesting sites on land and feeding sites in the adjacent ocean. All seabirds have rookeries on land, ranging from rocky promontories on the shoreline to remote islands. But many seabird populations face a special problem. Parents must fly to get food at sea, but climate change is changing the potential food availability, but the nesting sites are fixed. So the synchronization of breeding sites and nearby feeding is breaking down. In Scotland, the food supply of seabirds such as Atlantic Puffins and kittiwakes is breaking down, and many colonies are threatened with extinction. This problem is complicated by overfishing and pollution, which further threatens seabird food, such as sand eels. Warming is also shifting breeding seasons forward in time, which may increase the mismatch of breeding and available food in the nearby coastal ocean. As a result, a number of seabird species in the United Kingdom have been classified as threatened. This problem is widely urgent in the northern hemisphere (Sydeman 2021 Science DOI: 10.1126/science.abf17).
Oxygen and temperature. Higher ocean temperature means lower oxygen concentration and respiratory stress.
There is a fundamental relationship between temperature and dissolved oxygen. All animals, seaweeds, and most algae require oxygen. Yes, there is a whole world of microbial species that thrive without oxygen, but not fish, not whales and porpoises, not invertebrates like clams, arrow worms, squids, and so many more. Yet increasing temperature has an inevitable effect. Sea water cannot hold as much oxygen as temperature increases. As seawater warms up, dissolved oxygen will decline. Warming also combines with this phenomenon in an insidious manner. Warming tends to reduce seawater’s bulk density, which means that warming from above tends to stabilize the water column, with warmer water above and cooler water below. This makes the water column sluggish and reduces the flow of cooler water from the deep, which further reduces the flow of oxygen. A thoughtful paper (Levin 2018) is a good source for these concerns. Overall the oxygen in the ocean has declined by about 2 percent since 1960. Thus the global prospects for oxygen are concerning, adding another source of global stress owing to climate warming.
Carbon Dioxide and Ocean Acidification
Carbon dioxide is being produced prodigiously on land by burning of fossil fuels. About 26 percent of this production is dissolved into the ocean. That is a problem, because carbon dioxide tends to acidify seawater. Warmer water can hold less dissolved carbon dioxide than colder water, so this effect is greater in colder climates. Why does this matter: the effect of dissolved carbon dioxide is to increase the acidity of seawater, which has broadscale effects on the functioning and physiology of marine organisms. These effects can be on a macro scale such as altered behavior, but also occur on a cellular scale. The most obvious concern is biocalcification, so acidified waters will reduce the ability of organisms to precipitate calcium carbonate skeletons, which will affect corals, mollusks (oysters, clams, snails), and many other marine creatures. But the effects of acidification are much broader and may affect a wide spectrum of functions.
We will not discuss the details here, but you can find discussions of the chemistry on line. Global data have only been collected very recently, but here is an idea of the change off Hawaii.

You can see that seawater pH is declining steadily since the late 1980s. Please keep in mind, that the measure of acidification is much more complicated than just measuring pH.
So far, the effects of acidification globally are not yet widely apparent, with some glaring and worrisome exceptions. In the northeast Pacific, a phenomenon known as coastal upwelling is caused by persistent wind conditions. This brings deeper carbon dioxide-rich waters to the surface and has caused acidified conditions in the surface waters. As a result, we are already seeing some localized but major effects. Along inshore waters from Oregon to Alaska, acidification has affected bivalve mollusk populations. In Oregon, shellfish farmers are experiencing periodic acidified waters, which are greatly harming shellfish, especially the vulnerable early planktonic larva, which has a shell. Shellfish farmers have to add lime to the water to reduce the effects of acidification! These effects have been studied by Oregon shellfish biologists, who are monitoring ocean waters.
Offshore from the northwest Pacific coast of North America, the plankton are also imperiled. An important group of plankton are the pteropods, tiny planktonic snails that secrete a shell made of aragonite, which is a form of calcium carbonate that is relatively difficult to precipitate in acidic conditions. Pteropods are important food for juvenile fish such as salmon, so the surface oceanic food web is endangered now, owing to acidification. An especially important monitoring site is Tatoosh Island, just near Cape Flattery, Washington (the northwesternmost point of the lower 48 United States). Monitoring there has shown a steady increase in acidification over the past 20 years.
We can get an idea of the problem currently by looking at this map, which shows the state of saturation with respect to the mineral aragonite, which is precipitated by corals, many mollusks, and planktonic pteropods. At present, the tropics are not in danger, but look at the west coast of North America, which is a front line of the acidification problem.

Acidification state of the world at 50 m depth. Source: NOAA
SEA LEVEL RISE
Sea level rise has been an inevitable outcome of the global warming outcome of climate change from carbon dioxide and other anthropogenic emissions into the atmosphere. Sea level rise is a complex outcome of (1) Expansion of ocean volume owing to warming; (2) melting of ice, including polar ice caps, mountain glaciers and other sources; (3) local sinking of coastal continental land. Unfortunately, accurate estimates of sea level change did not begin until the 1990, although surrogate methods allow longer term estimate. Overall the effect amounts to a few mm per year, although local differences are widespread. Sea level rise has accelerated, doubling since 2016, relative to the early 1990s. Most models of climate change predict an acceleration of sea level rise into the future.
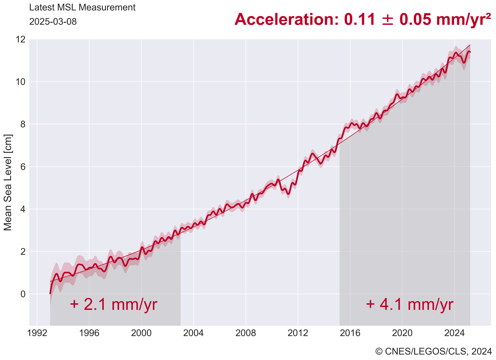
Sea level rise (source www.aviso.altimetry.fr)
CLIMATE OSCILLATIONS
WHAT ARE CLIMATE OSCILLATIONS?
We have talked about climate change as driven by greenhouse gases as a directional process. More greenhouse gases leads to more heat retention, which in turn leads to more warming. But climate is much more complex. A series of climate oscillations, acting over the scale of a few years to decades, exert major effects on climate. These oscillations are not necessarily very regular and often have geographically localized effects, but the nature and direction of the fluctuations are relatively predictable. Here is a list of some of major climate oscillations:
- El Niño- Southern Oscillation (ENSO), 2-7 years, global in extent, but most noticeable in Pacific.
- North Atlantic Oscillation (NAO), No known periodicity, North Atlantic shift in pressure between the region of Iceland and the Azores.
- Pacific Decadal Oscillation, 10 years with variation, Middle latitudes of North Pacific, alternating warm and cool waters
- Arctic Oscillation, no known periodicity, Shift in pressure between Arctic and low latitudes, affecting distribution of cold Arctic air over varying latitudes
- Interdecadal Pacific Oscillation, several shifts in 20th century, shifts in pressure in the NorthPacific Ocean, affecting shifts of temperature.
- Antarctic Oscillation, no known periodicity, shifts in pressure in the Antarctic Ocean and another at South latitude 40-50 degrees
- Intertropical Convergence Zone, semiannual cycle, Northern summer development of monsoon over southern Asia with strong cyclones, Southern hemisphere summer monsoon with weaker development of cyclones
- Indian Ocean Dipole, irregular, Eastern Indian Ocean becomes alternately warmer, then cooler, than the western Indian Ocean
The most conspicuous thing about these oscillations is how irregular they are. But even more importantly, they superposed climate fluctuations that interact with the steady warming that we have been experiencing since we have been adding such large amounts of greenhouse gases into the atmosphere. So right now in June 2023, when the planet is at record high global air temperatures, we are entering a warming phase – El Niño.
Let’s use the El Niño southern oscillation as an example because we are now entering into a warming phase of this oscillation in June 2023. This oscillation (the southern oscillation is a Pacific oscillation that was later discovered to be coupled to El Niño) is a major alternation of atmospheric pressure conditions between the western and central eastern tropical Pacific and it helps to change wind systems may in a major way. When does a major driver of ocean current systems and so there’s a coupling with surface oceanic currents which are also connected to vertical oceanic movements. To summarize in the Pacific, warm water moves from West to east and strongly affects a normal cold-water system that is found offshore from northwestern South America. During the alternative cold phase known as la La Niña, vertical rising of water known as upwelling brings cool water to the surface and drives high biological productivity in surface waters off the coast of a country such as Peru. But during the warm phase, known as El Niño , this is shut down and coastal waters of Peru and the rest of the western coasts of the Americas experience a warming event. But El Nino has far greater effects on a global scale. It’s just that they are more noticeable in the eastern tropical Pacific. It took many decades to understand just how geographically widespread the El Niño – La La Niña alternation of climate really is.

This is the ENSO Oscillation between El Niño (warming) and La Niña (cooling) conditions. Source NOAA

These satellite maps show temperature deviations from long-term averages. So red means unusually warm, blue means cooler than typical. The top map shows surface conditions during the La Niña phase in 1988, and the lower map shows conditions in the El Niño phase in December 1997. In summer 2023 we are entering a warming El Niño phase.
see more: https://www.climate.gov/news-features/blogs/enso/what-el-ni%C3%B1o%E2%80%93southern-oscillation-enso-nutshell
ENSO + CLIMATE CHANGE = Catastrophe?
In spring 2023, El Nino conditions have resumed, and during this time extraordinarily high ocean temperatures were noticed, especially in the Gulf of Mexico. Waters of south Florida are especially warm, and extensive coral bleaching has been found along the Florida Keys. A new unfortunate record has been surpassed. South Florida coastal waters have approached 37 degrees C ( ~100 degrees F). A summer 2023 bleaching event resulted in the death of most coral transplants in restoration efforts. Since 2023, warming has had catastrophic effects on coral reefs over the globe.
Resources
University of North Carolina Climate Change References
References
Hansen, J., M. Sato, R. Ruedy, K. Lo, D. W. Lea, and M. Medina-Elizade. 2006. Global temperature change. Proceedings of the National Academy of Sciences (USA), v. 103, pp. 14288–14293.
Harvell, C.D. et al. 2019. Disease epidemic and a marine heat wave are associated with the continental-scale collapse of a pivotal predator (Pycnopodia helianthoides). Science Advances vo.5, no. 1, eaau7042 DOI: 10.1126/sciadv.aau7042.
Henley, B.J. et al. 2024. Highest ocean heat in four centuries places Great Barrier Reef in Danger. Nature volume 632, pages320–326
Johnson, D.S. 2014. Fiddler on the roof: A northern range extension for the marsh fiddler crab, Uca pugnax. Journal of Crustacean Biology, v. 34, pp 671-673.
Jones, S. J., N. Mieszkowska, and D. S. Wethey. 2009. Linking thermal tolerances and biogeography: Mytilus edulis (L.) at its southern limit on the east coast of the United States. Biological Bulletin, v. 217, pp. 73–85.
Levin, L. A. 2018. Manifestation, drivers, and emergence of open ocean deoxygenation. Annual Review of Marine Science 10:229-260.
Rogers-Bennett, L., Catton, C.A. 2019. Marine heat wave and multiple stressors tip bull kelp forest to sea urchin barrens. Sci Rep 9, 15050 (2019). https://doi.org/10.1038/s41598-019-51114-y
Wahle, R. A., Gibson, M. & Fogarty, M. (2009) Distinguishing disease impacts form larval supply effects in a lobster fishery collapse. Marine Ecology Progress Series, 376, 185-192, doi: 10.3354/meps07803.