By Shaunna Vargas
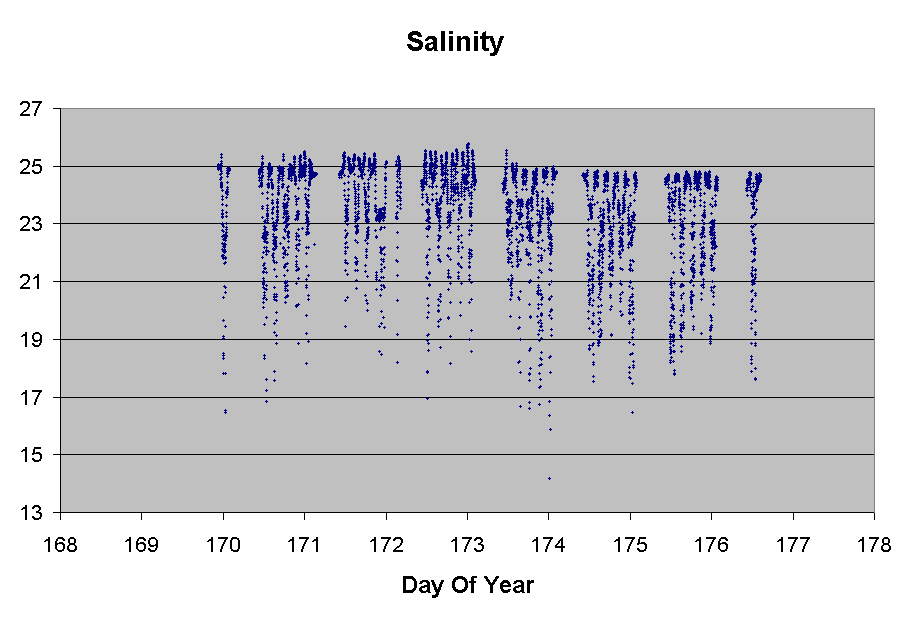
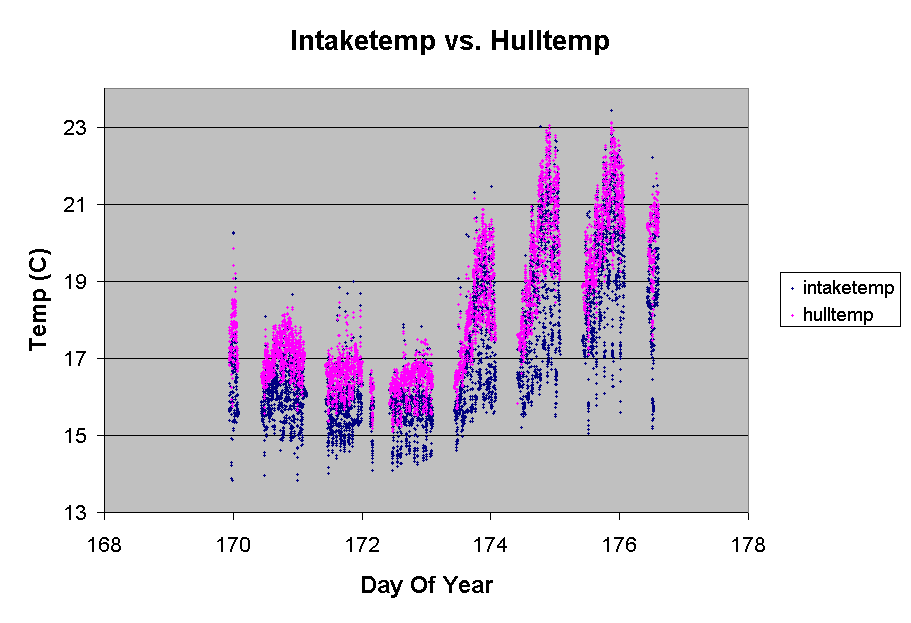
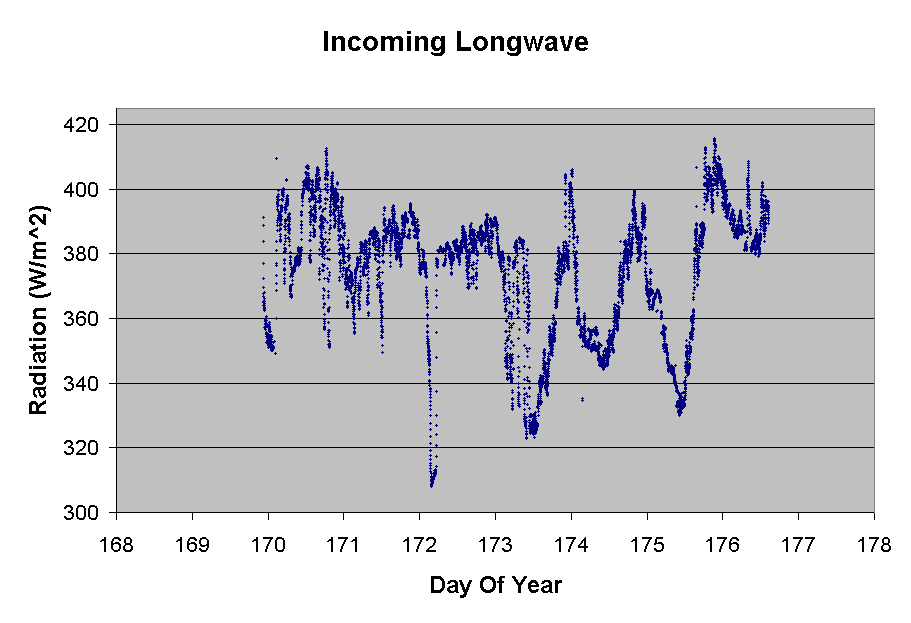
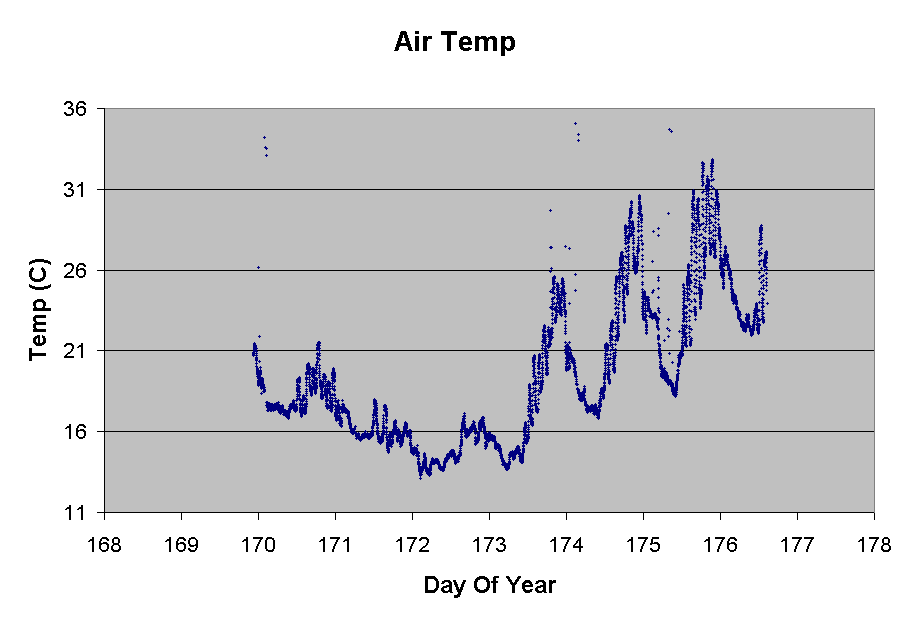
This data is plotted vs. day-of-year, such that 180.5 would be noon on the 180th day of the year. June 19th is the 170th day.
This is a plot of the intake temperature sensor vs. the hull temperature sensor on the P.T. Barnum. The intake sensor is 2.5 meters below the waterline, and the hull sensor is 0.5 meters below the waterline. During this time, the power to these sensors was being shut off at night, but this has since been corrected.
This is a plot of the longwave radiation over the week. You can see it becomes much more negative later in the week, which is when the temperature warm-up occurred.
This is a plot of the shortwave radiation over the week. You can clearly see the peak of intensity in the early afternoon each day.

With the air temperature, you can see a dip in the middle of the week, followed by a dramatic warm up late in the week. The temperature peaks during the daytime hours become much more pronounced later in the week as well.
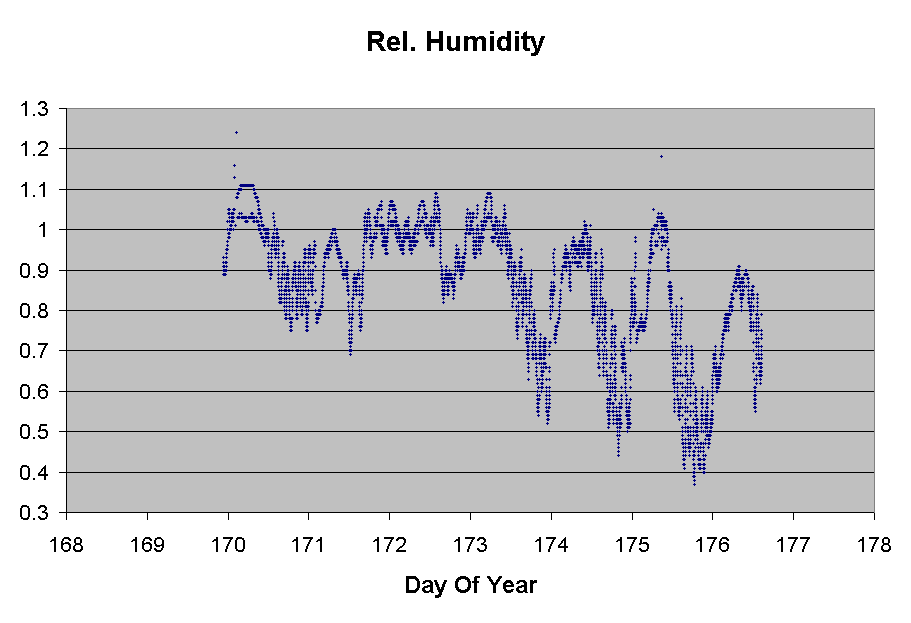
This is a plot of the relative humidity over the week, and you can see that it decreases later in the week, when the temperature of the air increases.
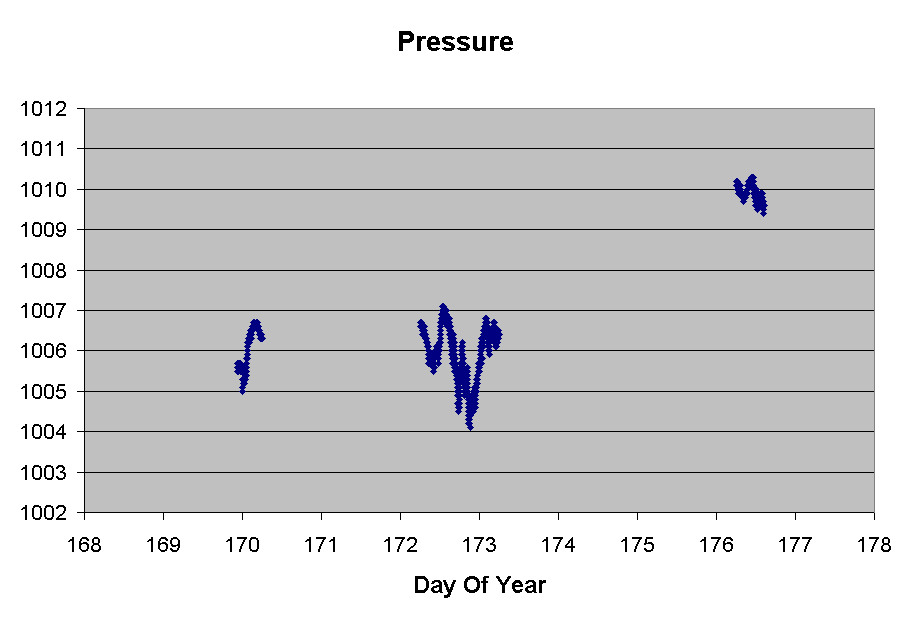
This plot of pressure over the week has only 2 days worth of accurate data, but this data collection problem has since been corrected.
Here is a plot of the wind speed in meters per second. You can see that it reaches its peak late in the afternoon/evening each day of this week.

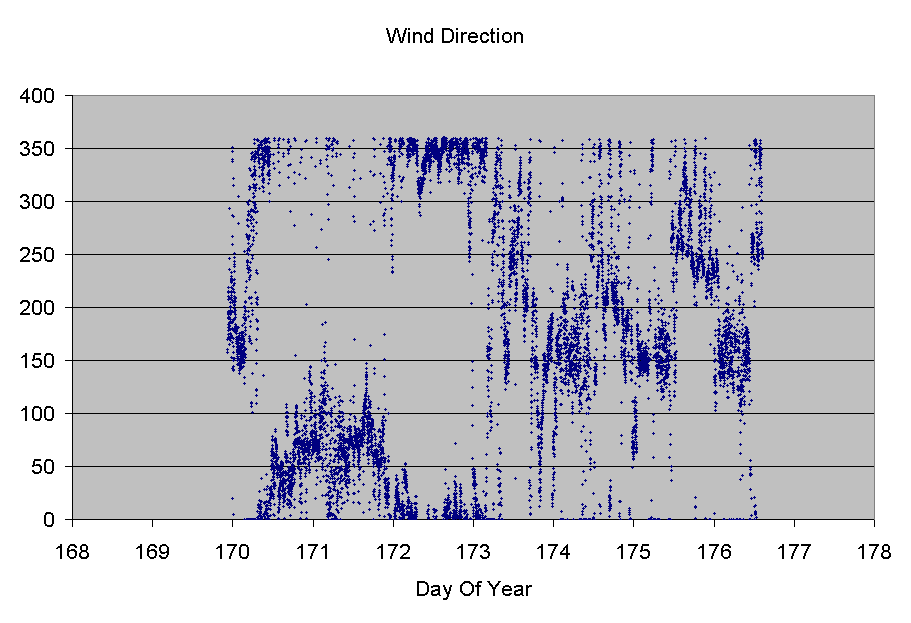
This is a plot of wind direction, where 0 and 360 degrees are both oriented to the north.
This is a plot of the salinity vs. day of year. The salinity is only measured when the boat is running, which explains the gaps in the data.
