Eastern Seaboard and Long Island Sound From a Distance
seawifs.browse
NASA SeaWiFs image of the Northeastern United States on October 12, 2000. Image data was collected by the SBU-BNL Satellite Receiving Station.
Topography Map
Elevation map for Long Island Sound (LIS) and surrounding regions. Water depths are shown in 20 m color increments. Average LIS depth is 20 meters. The maximum depth is about 100 meters at the east end – known as the Race.
Sea Surface Temperature
Sea Surface Temperature from NOAA polar-orbiting weather satellite for June 22, 1999. Values range between 15C to 20C (purple to red). Image data was collected by the SBU-BNL Satellite Receiving Station.
Long Island Sound
sound2-2kzewfo
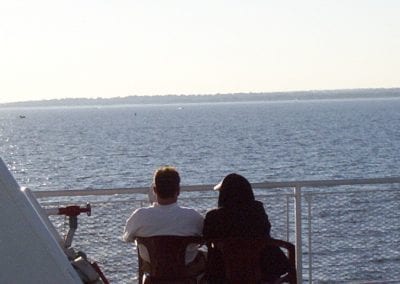
The Long Island Sound with the city of Bridgeport in the horizon as seen from the PT Barnum.
sound3-2aol3l2
The Long Island Sound with the North Shore of Long Island in the horizon as seen from the PT Barnum.
PortJeffFerryBathymetry_1000-1x7agz3
Long Island Sound Bathymetric Chart, compiled as part of the MSRC REU 2003 project by J. Shambaugh and Dr. R. Flood. NOS Chart data obtained through NOAA’s Geophysical Data Management System hydrographic survey database; data from 1934 to 2001. The dots indicate the ferry tracks from January to June 2003, and the squares indicate the CTD stations.
Port Jefferson, NY
pjharbor-v9g78i
The American flag with the Port Jefferson Marina in the background as seen on the PT Barnum Ferry.
Bridgeport, CT
Ferry Fleet
grandrepublic-27otqds
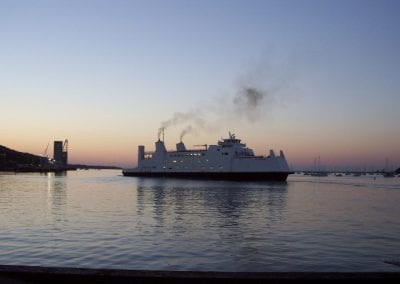
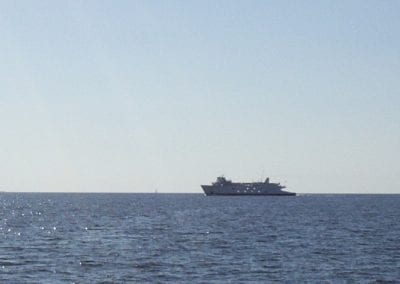
Grand Republic ferry crossing the Long Island Sound as seen from the PT Barnum.
On Board the P.T. Barnum
Installed Instruments
pdisplay.close-2nxw714
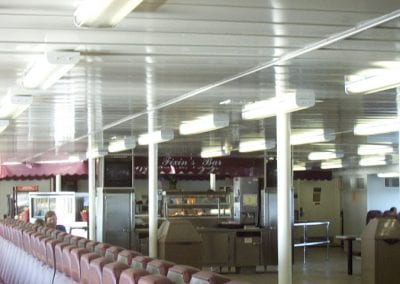
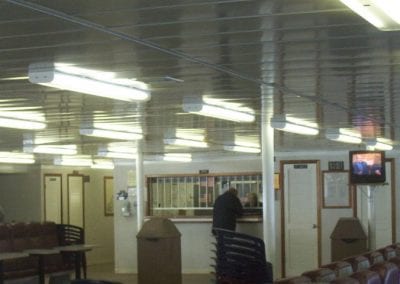
The on board display in the passenger deck of the PT Barnum displays a video of the project, most recent data and the location of the vessel on a map of the Long Island Sound.


