Fig. 1. Raman-based chemical maps of the intracellular distributions of protein (blue/green), fatty acids (purple/yellow), and cholesterol (red/yellow) in a single microalgal cell. Emiliania huxleyi is a cosmopolitan phytoplankton species shown as a reflected bright field micrograph in upper left panel .
Click on image for full page display.
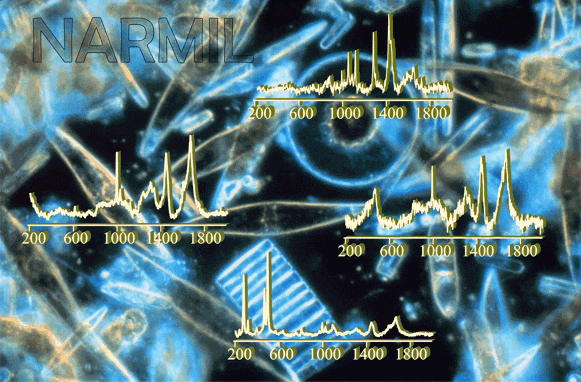
Fig. 2. Assorted Raman spectra (foreground) from an oceanographic sediment trap collection sample that was dominated by diatoms (pictured in the background) (photo credit – G.T. Taylor).
Click on image for full page display.
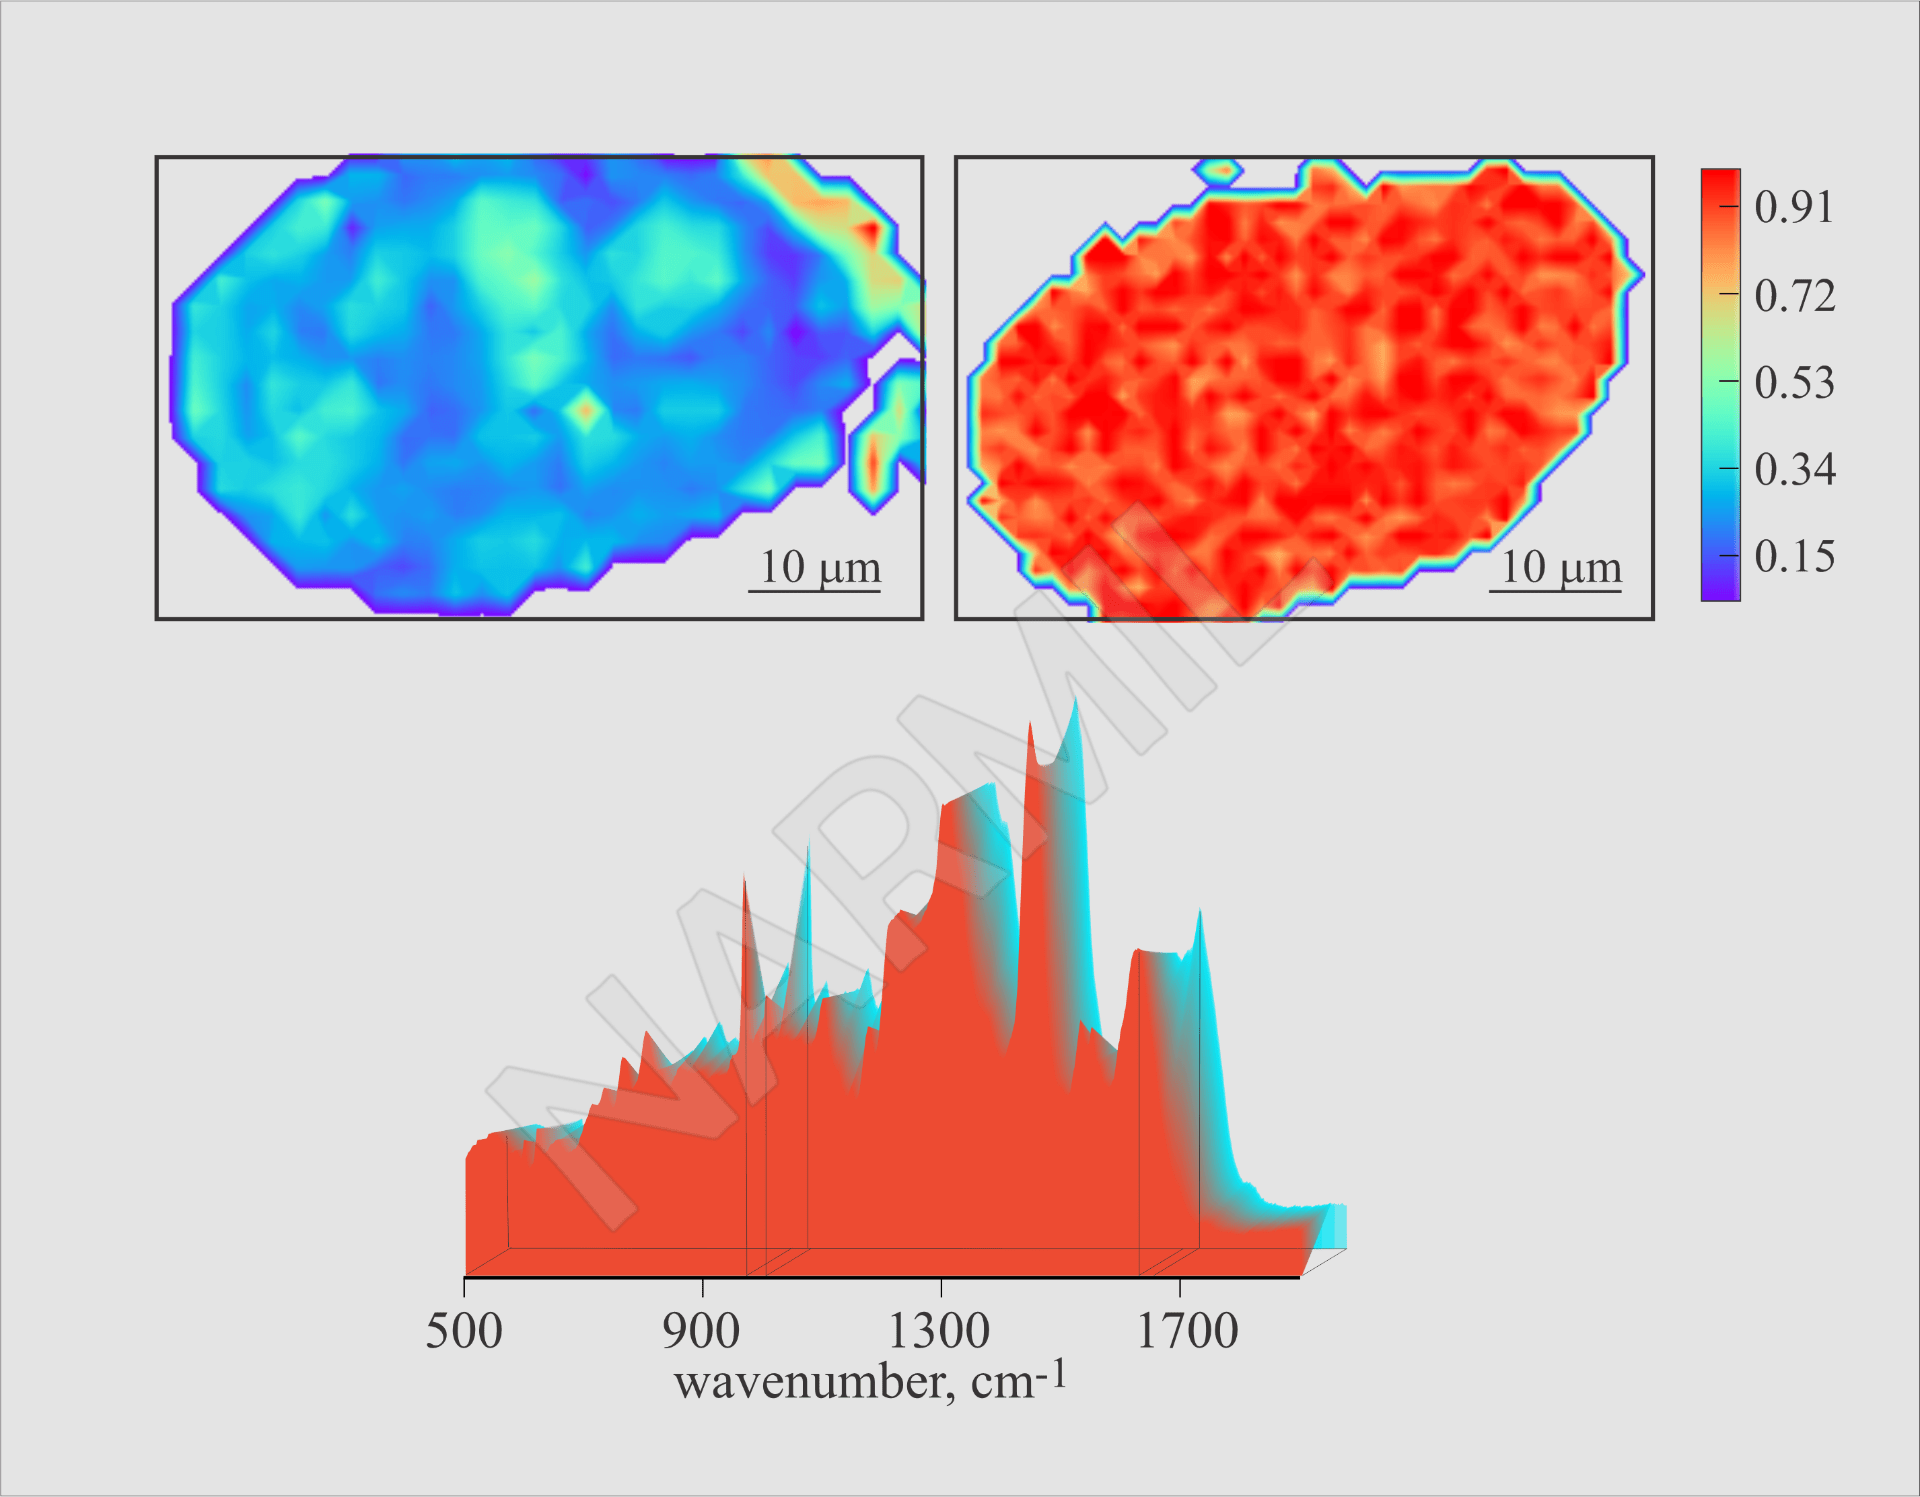
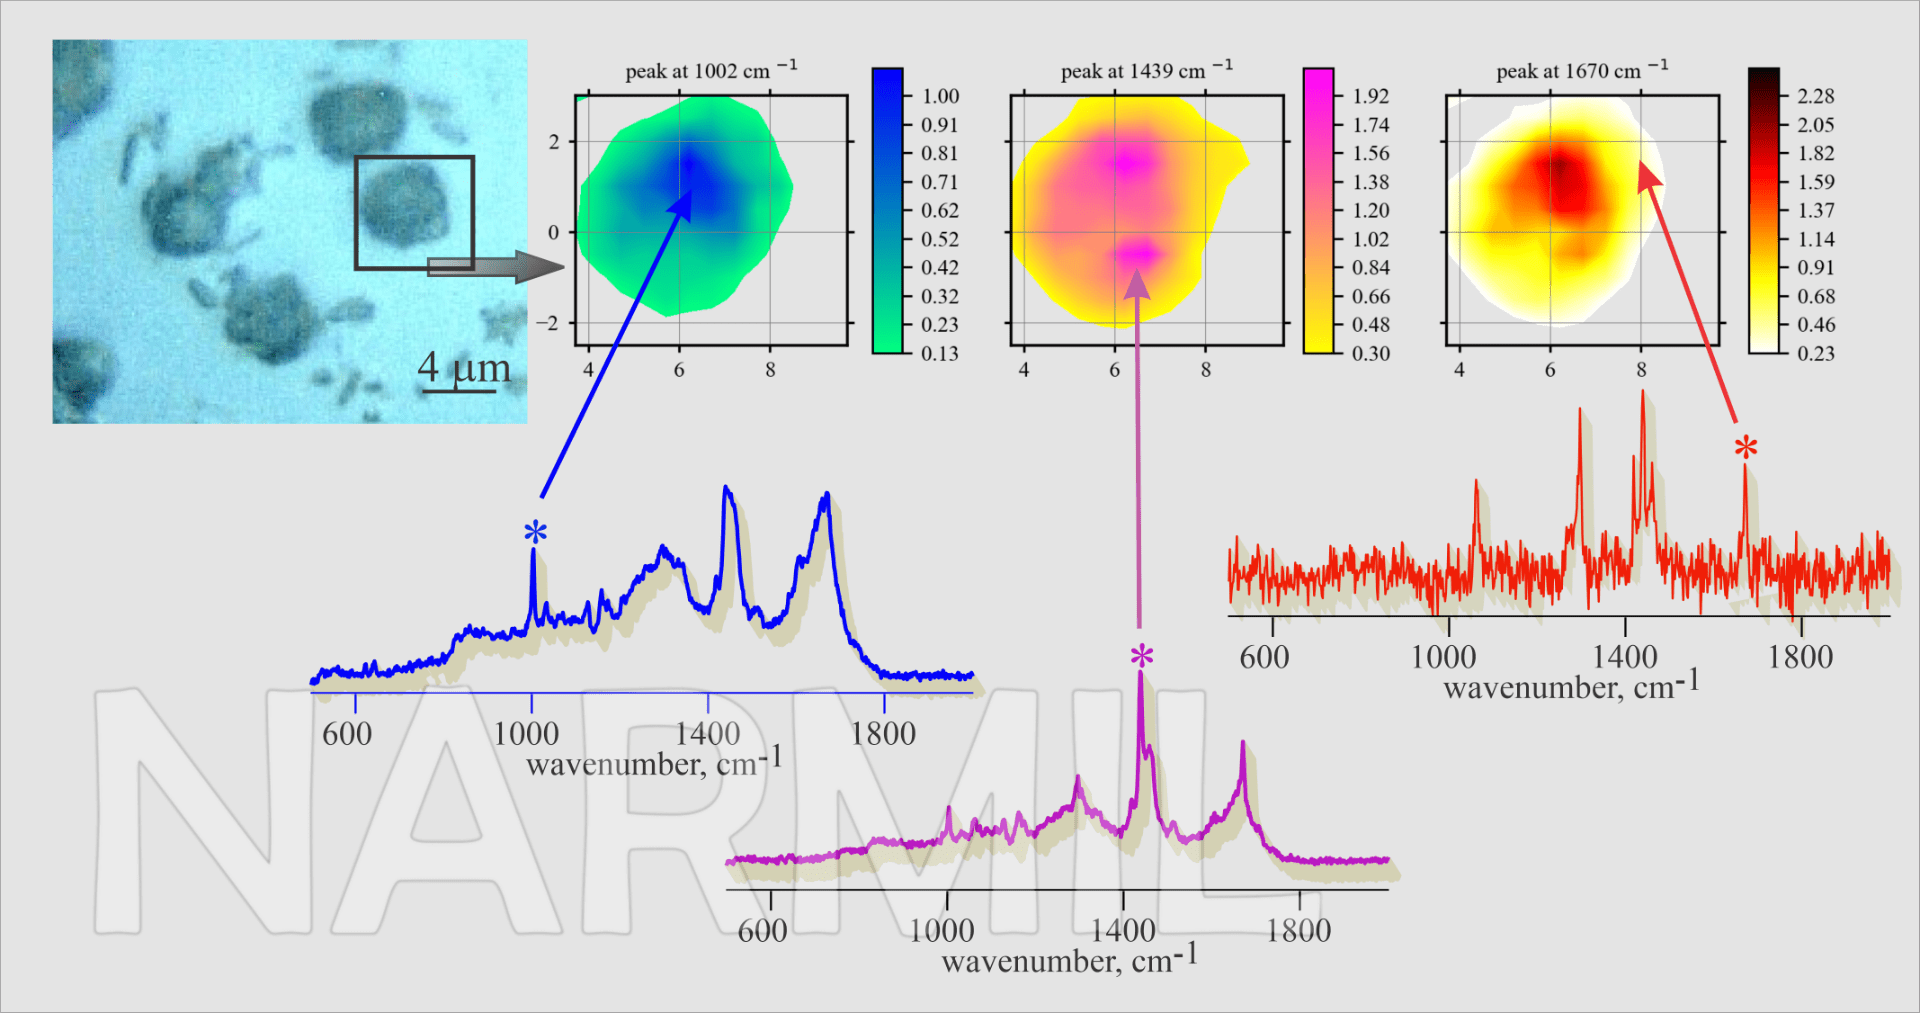
Fig. 3. Two-dimensional Raman maps (upper) of subcellular distribution of ¹³C-label assimilation into protein in single Tetrahymena cells (ciliated protozoan) after 6 and 27 hours of grazing on ¹³C-labeled prey. Spectra (20 sec) acquired every 1 μm in x-y dimensions. Peaks at 1002 and 967 cm-1 are diagnostic for ¹²C-phenylalanine and ¹³C-phenylalanine, respectively, and serve as a proxy for protein labeling (Weber, Zaliznyak, Edgcomb and Taylor, unpubl. data).
Click on image for full page display.

Fig. 4. Three-dimensional Raman map of a polyethylene microplastic particle based on peak intensities at 1296 cm-1 (Medina, Zaliznyak and Taylor, unpubl. data).
Click on image for full page display.
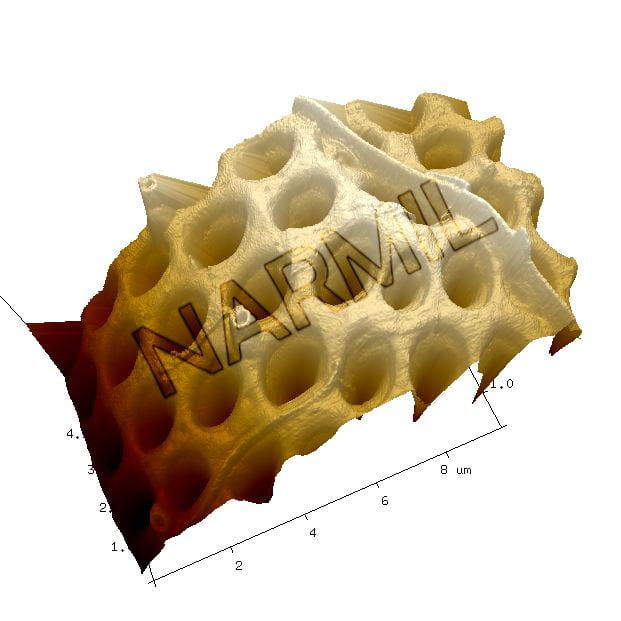
Fig. 5. High resolution topographic map of the shell (frustule) of the diatom (microalgae) Thalassiosira rotula. Image of an 8×10 μm section was created with NARMIL’s Bruker Atomic Force Microscope (AFM) (Krause, Marquez, Zaliznyak and Taylor, unpubl.).
Click on image for full page display.
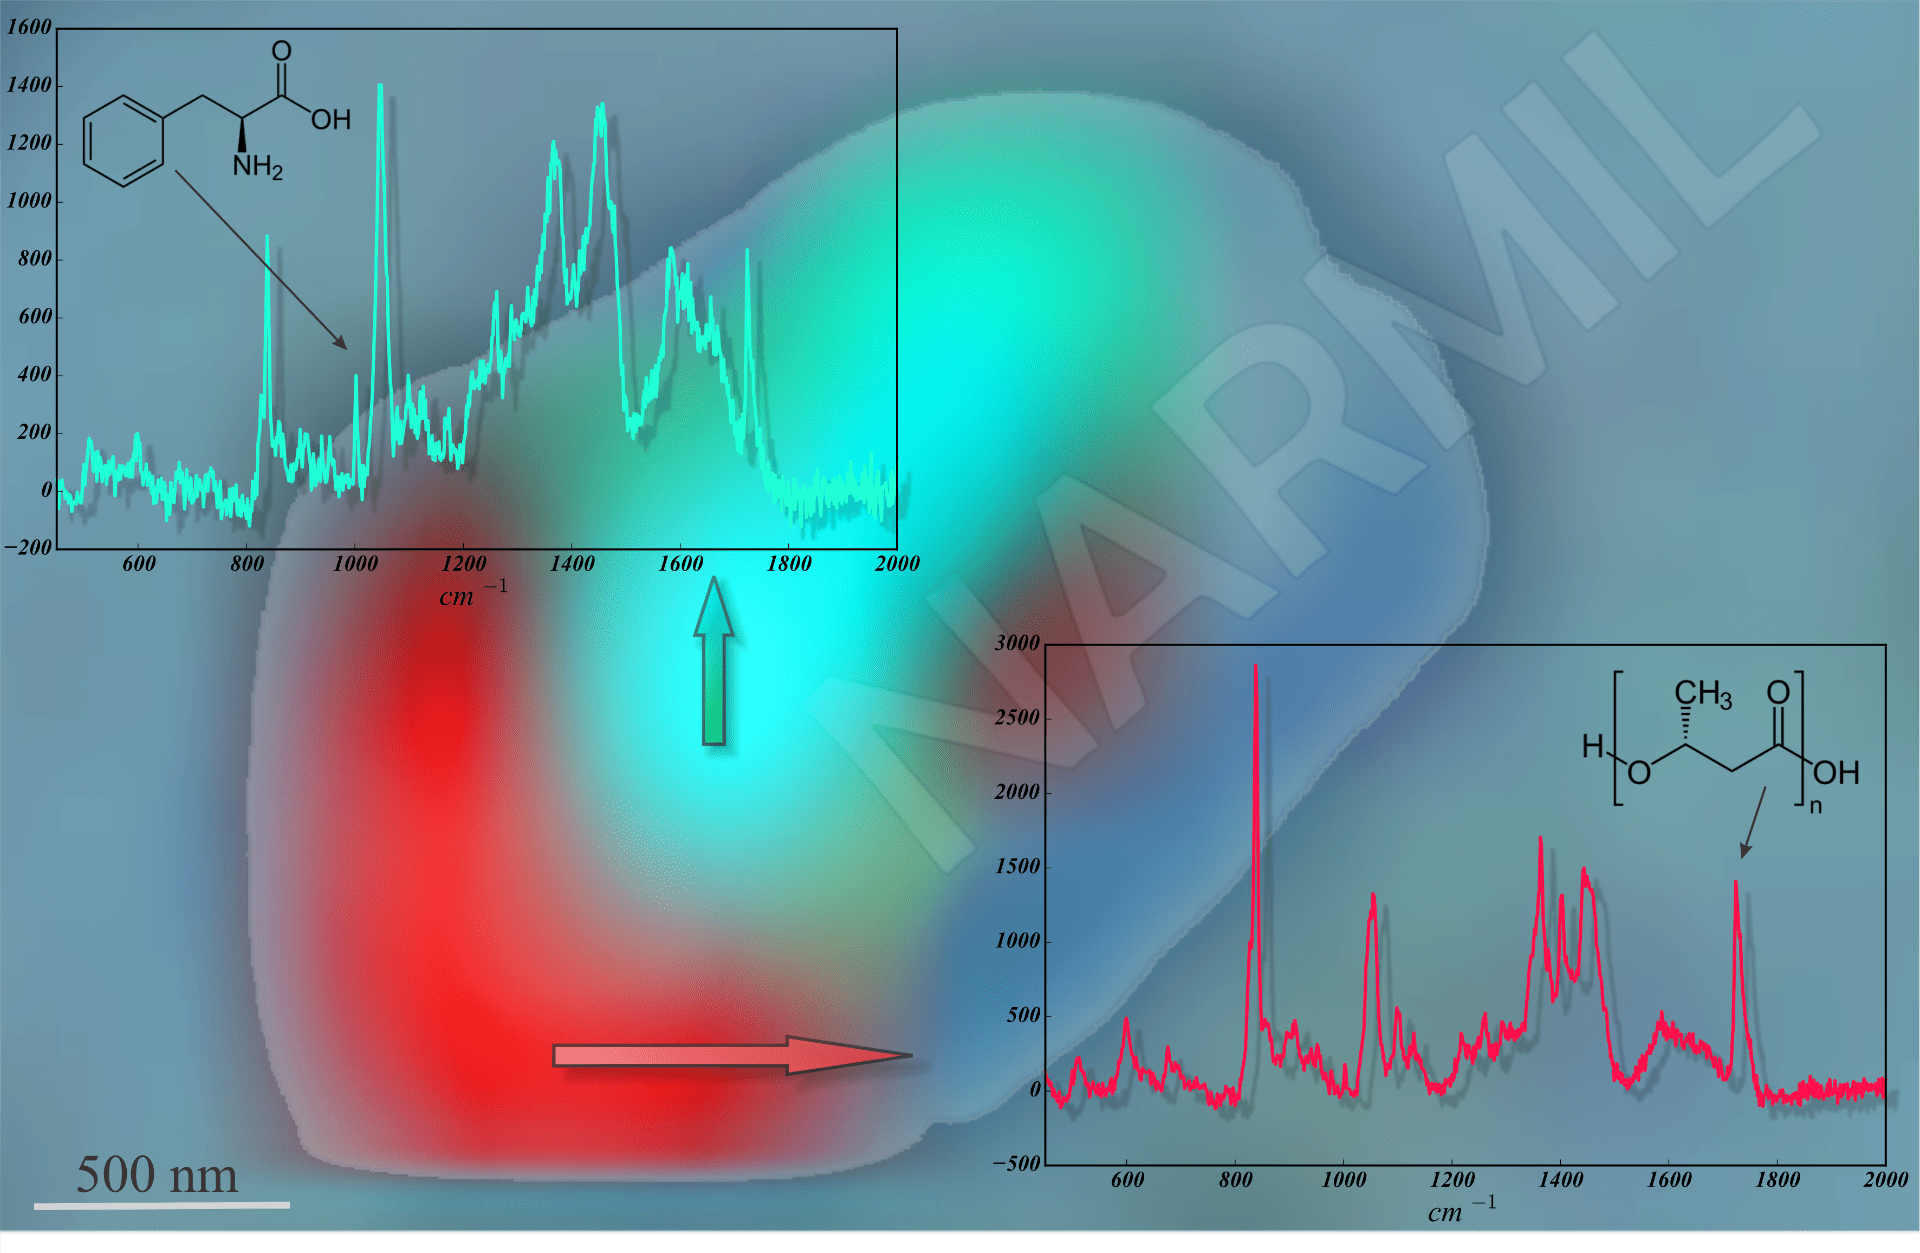
Fig. 6. Foreground – Raman spectra of cellular macromolecules (blue) and polyhydroxybutyrate (PHB – red), a bacterial energy storage molecule. Background – Two-dimensional Raman map of intracellular distributions of PHB polymers (red) and proteins (blue). Maps are based on the relative intensities of peaks at 1740 and 1002 cm-1, diagnostic for PHB and phenylalanine, respectively. Under nutrient stress, some bacteria store this fat-like product.
Click on image for full page display.
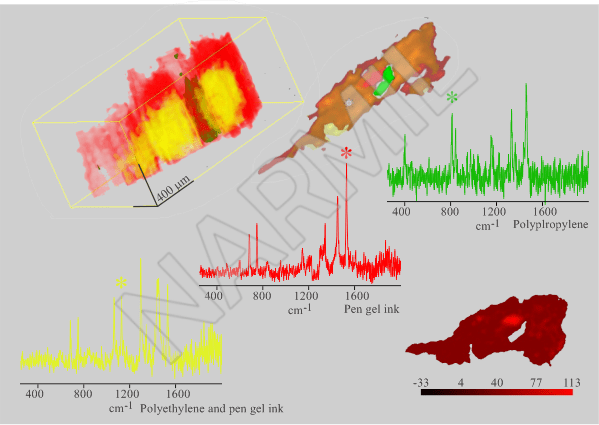
Fig.7. Two and three-dimensional Raman maps of a composite microplastic particle collected from Pt. Jefferson Harbor, NY. Green, red, and yellow spectra represent polypropylene, gel ink, and a mixture of both, respectively. Maps show spatial distributions of these plastic ingredients within the particle. No other tool is capable of revealing 3-D distributions of ingredients in microparticles as structurally complex as this example (Medina, Zaliznyak and Taylor, unpubl. data).
Click on image for full page display.

Fig. 8. Three-dimensional Raman volume maps of sub-millimeter polypropylene microplastic particles. The volume maps can be used to calculate the actual mass of microplastics needed for global contamination budgets (Medina, Zaliznyak and Taylor, unpubl. data).
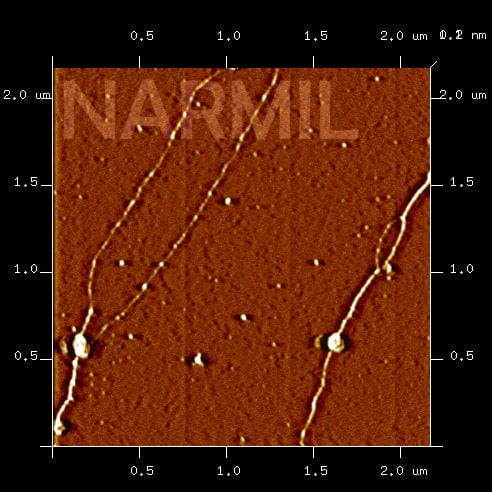
Fig. 9. Atomic Force Microscopic image of plasmid DNA deposited on a mica substrate. No special processing was required and image was acquired under standard room conditions (25°C, 1 atm pressure, and 60% relative humidity). Double-stranded DNA has a 2 nm (2 x 10⁻⁹ meters) diameter. For comparison, the diameter of an average human hair is 60,000 nm.