


Real-Time Data and Plots
Data are being collected from eight stations on the Great South Bay using SeaCat instruments measuring temperature and salinity. The stations include, from east to west on the north shore: Smith Point, Bellport, Blue Point, Islip and Tanner Park, and the US Coast Guard Station and Barrett Beach on Fire Island. The instruments are deployed for as much as three months at a time, less in the summer due to heavy biofouling.
Real-Time Data
In addition to the delayed-mode SeaCat data, meteorological data are being collected from the south tower of the Smith Point bridge and these data are available in real time below. That data includes temperature and salinity from the Smith Point SeaCat, short and long wave radiation from Eppley pyronometers, and wind speed, wind direction, air temperature, humidity, barometric pressure and rainfall rate from a Vaisala WXT520.
On October 6th, 2010 we deployed GSB #1 buoy south of Sayville at 40o 41.6’N, 73o 05.1’W. This buoy reports wind speed and direction, air temperature and humidity, photosynthetically active radiation (PAR), water temperature and salinity, chlorophyll-a fluorescence and turbidity. On December 29, 2010 ice forming in the Bay carried the buoy quite a ways as the ice sheets broke up and started to move around. The ice finally released the buoy south of Islip in mid-February at which time we towed the buoy to the West Sayville Marina on February 17th. After checking on the systems and repainting, the buoy was towed out and re-anchored near its original location, 40 41.552 N, 73 5.144 W, on March 23, 2011. The winter of 2011-2012 was particularly mild and we did not have any trouble with ice flows but significant ice build up in January 2013 captured the buoy again and dragged it first south and then some two miles west. It will be returned to its proper location as soon as possible.


Bellport Marina
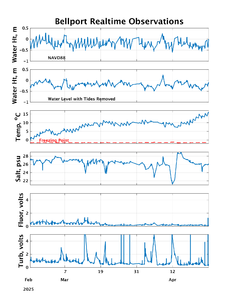
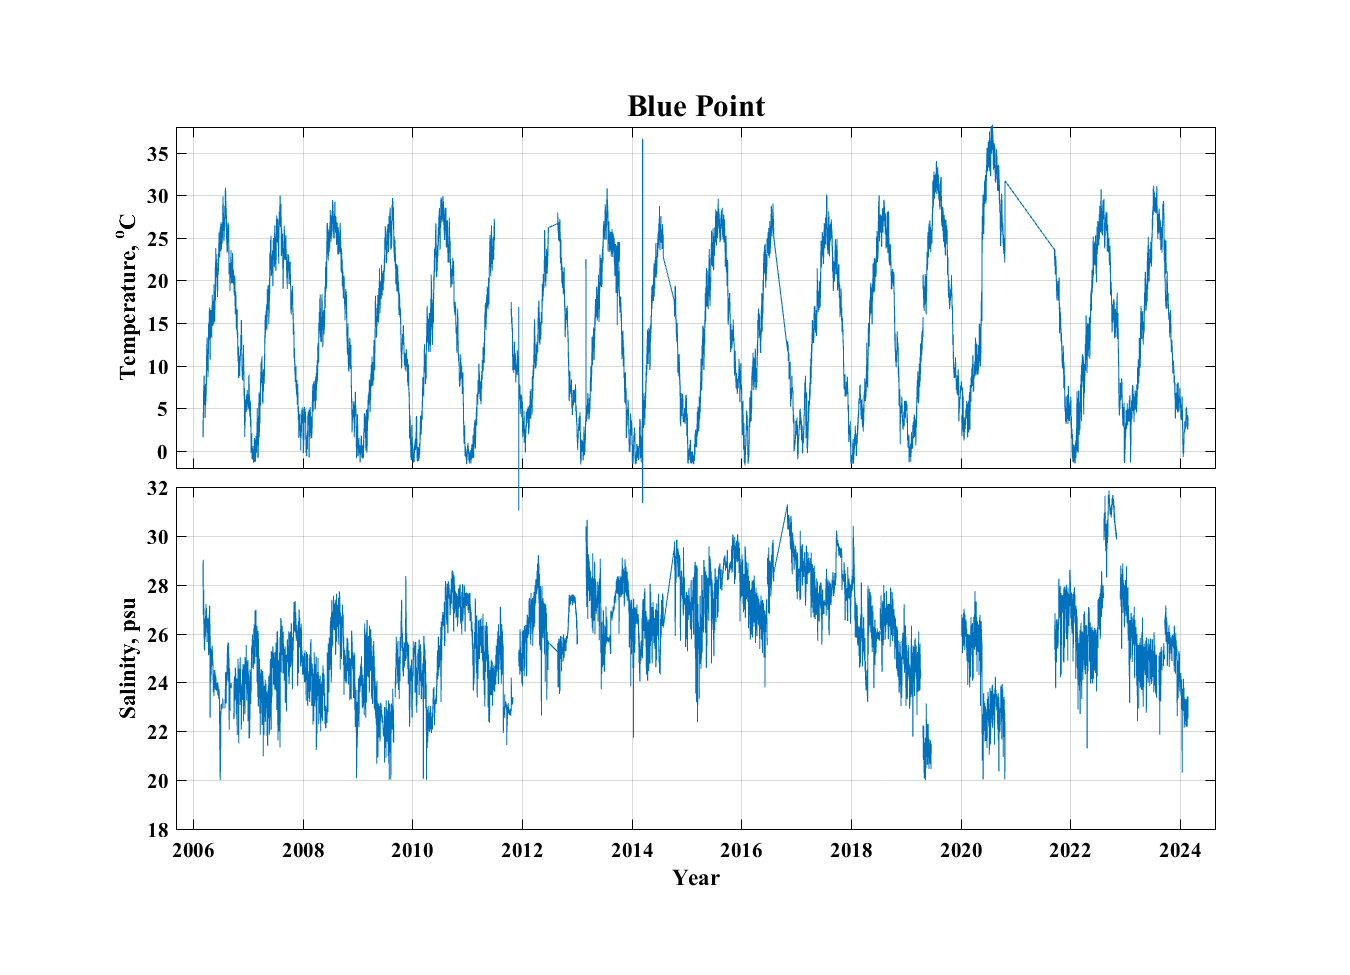
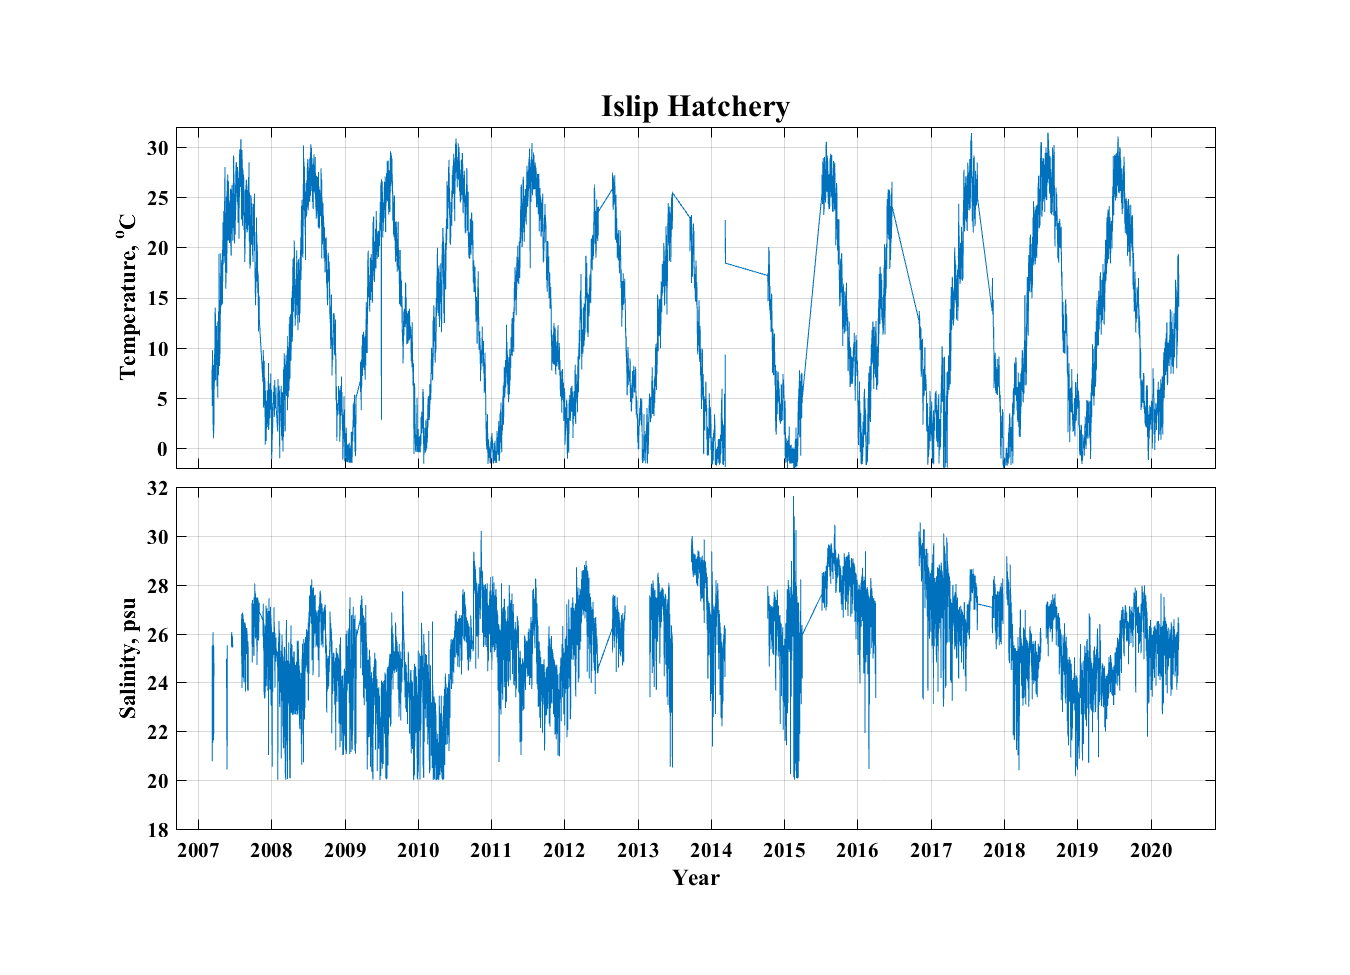
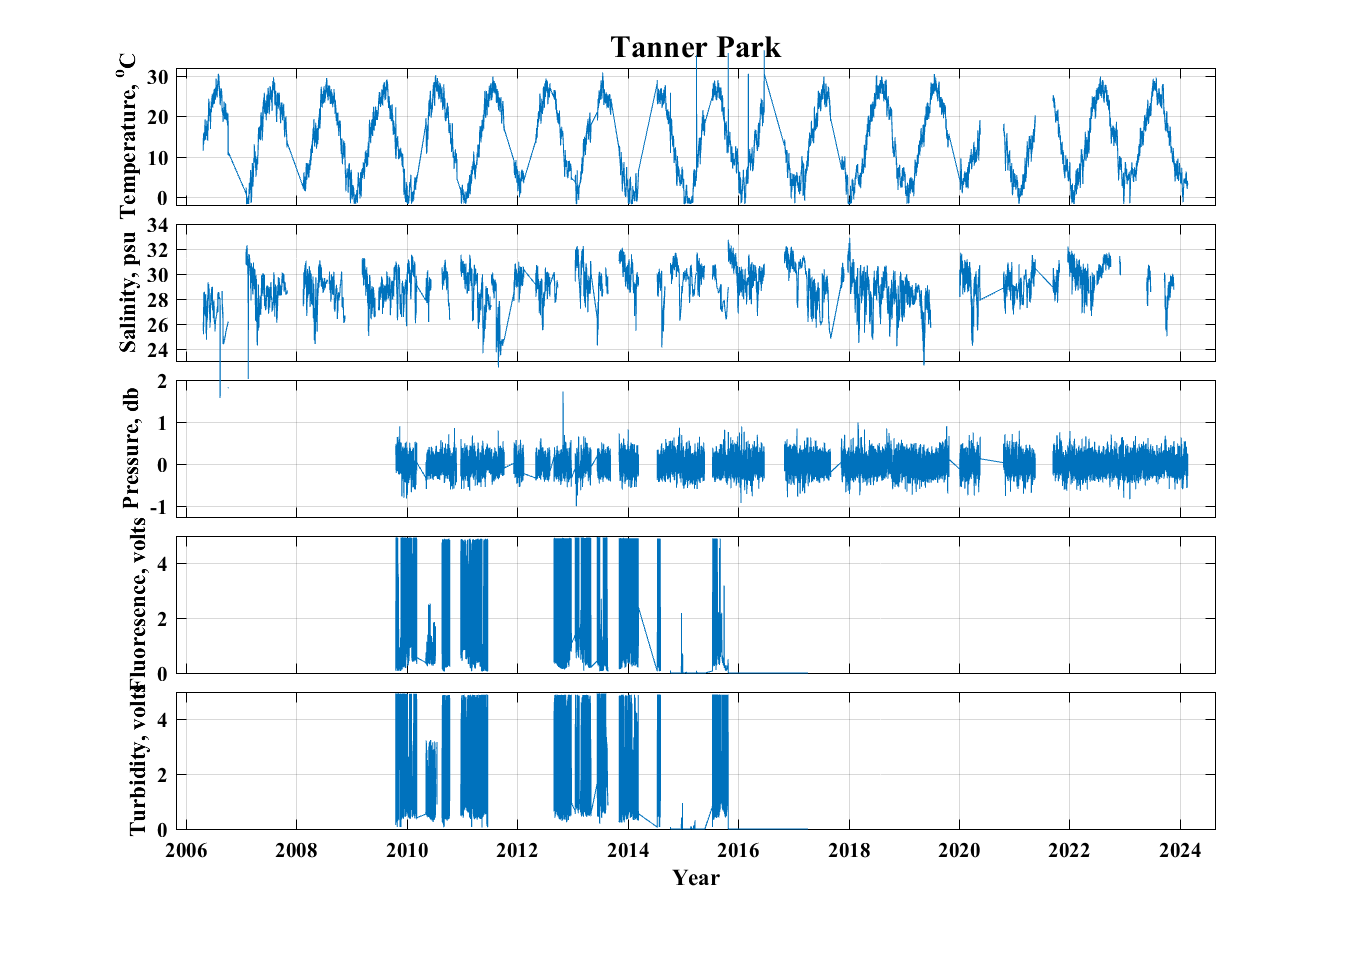
Delayed-Mode SeaCat Data from sites around Great South Bay
Bellport

Blue Point
Islip Hatch/Fish Pier
Tanner Park
Smith Point

USCG Fire Island Inlet

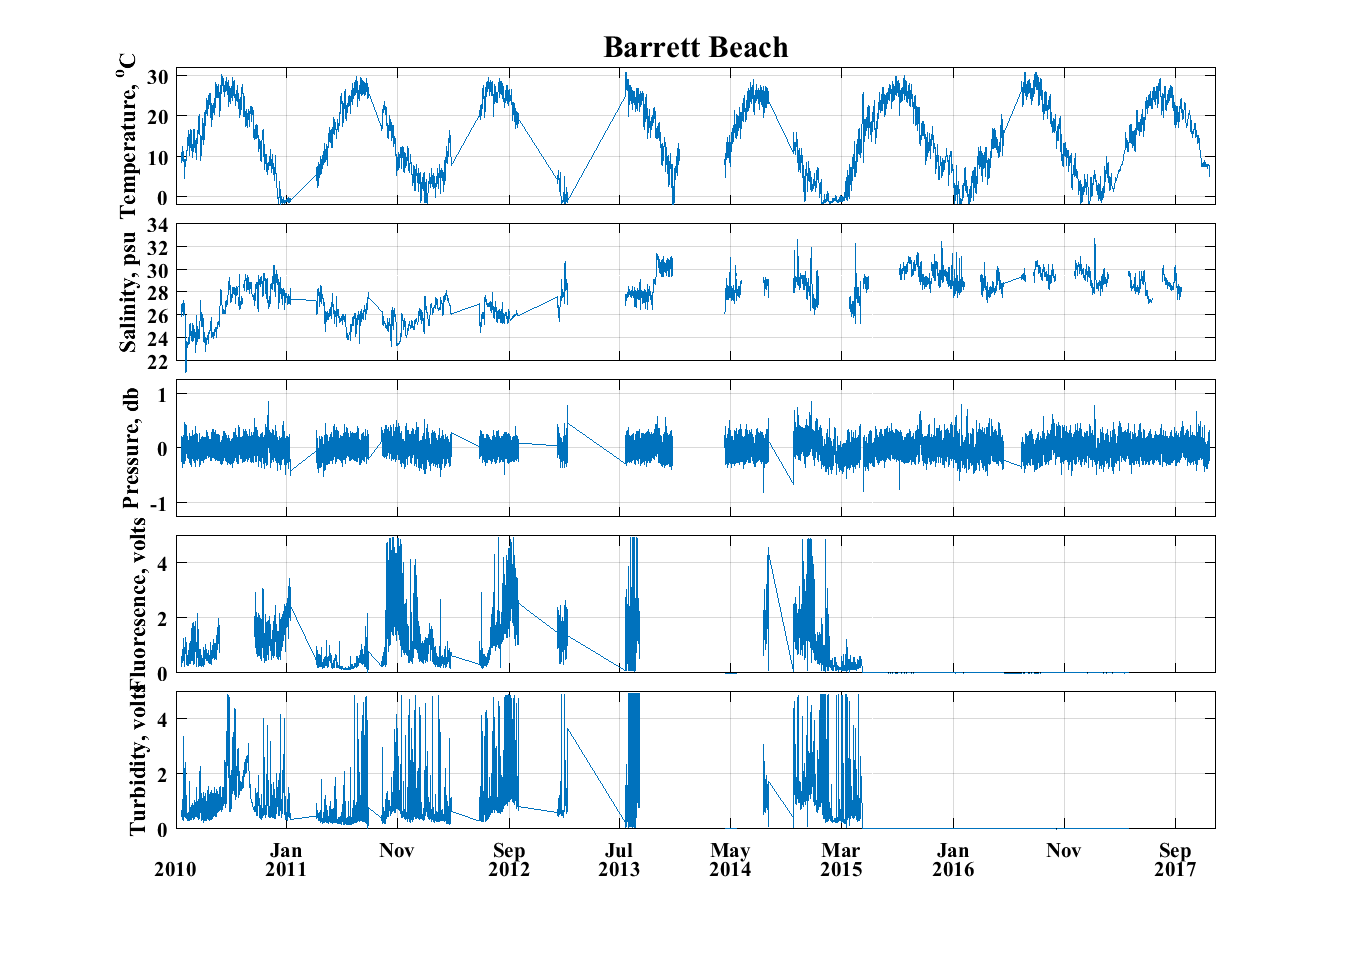
Barrett Beach
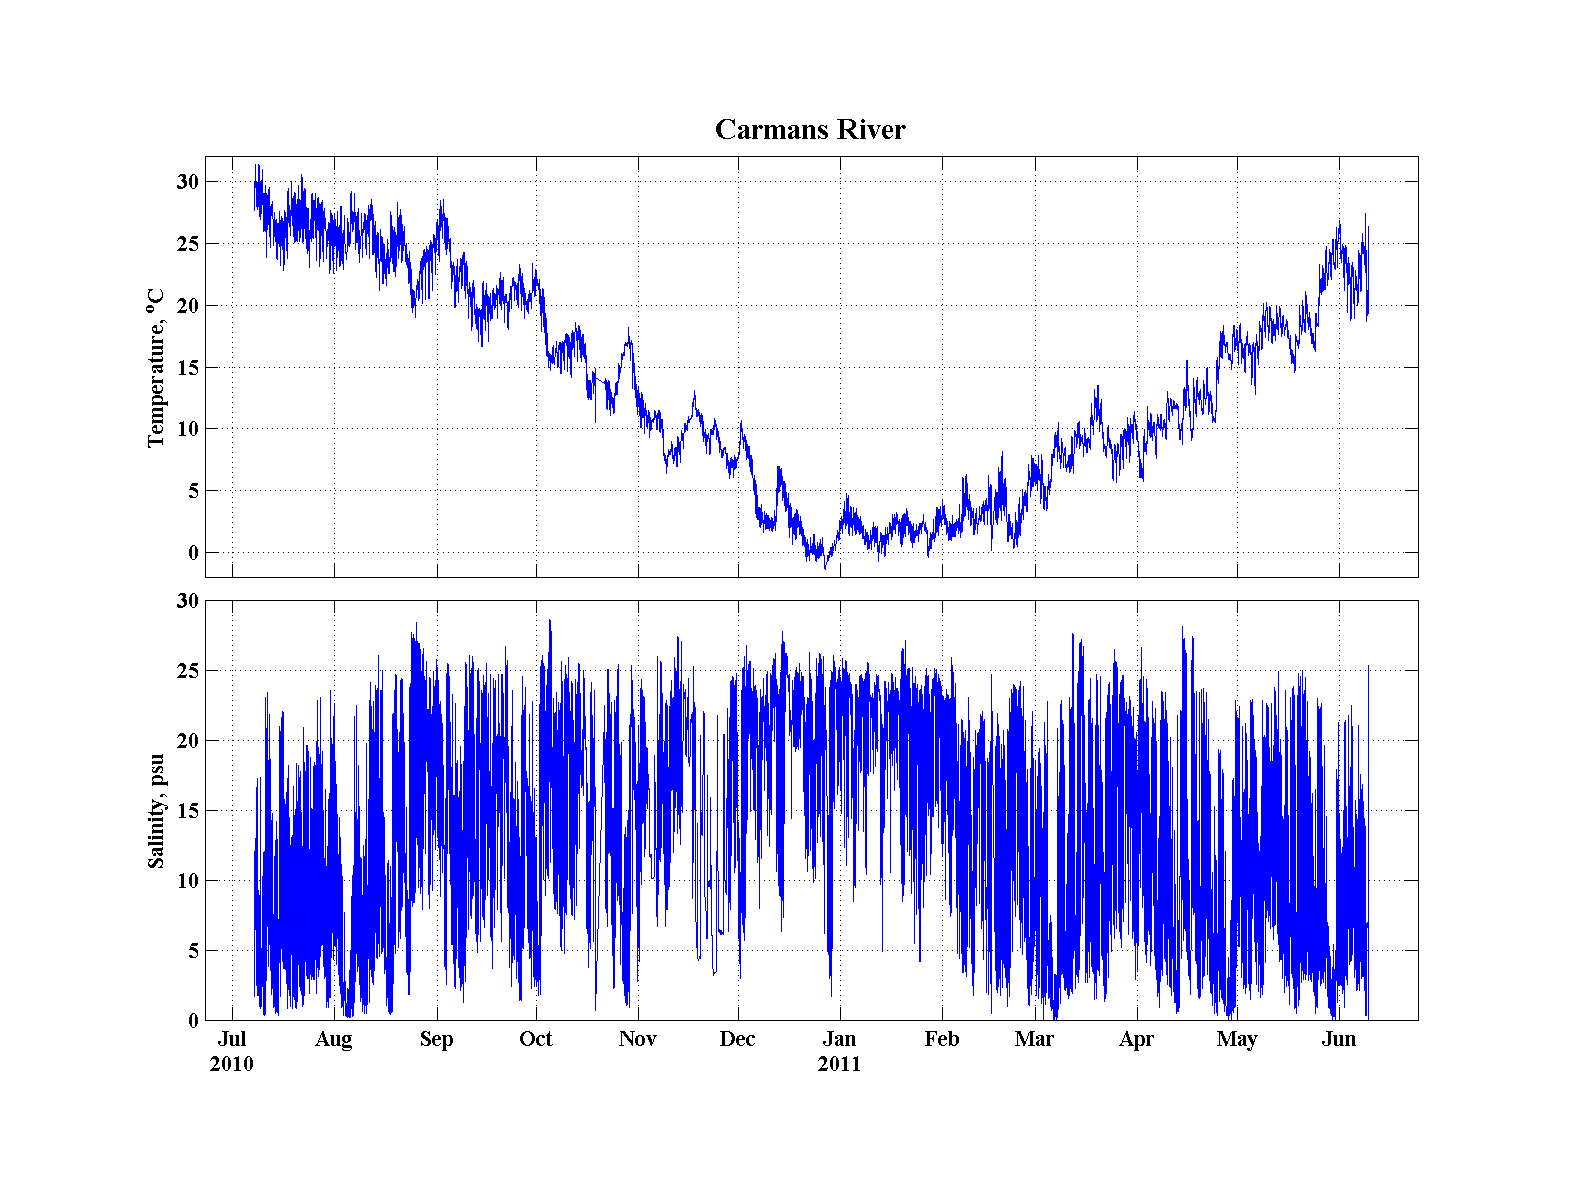
Carmans River
To download the data for the entire records for each location, click on the links in the table below. The matlab
files have the complete 6-minute edited data while the ASCII files contain the hour-averaged data in a form
better suited for non-Matlab users.
| Right-click to download any of the data files | ||
| Location | Matlab Data Files | ASCII Data files |
| Barret Beach on Fire Island | Barrett Beach matfile |
Barrett Beach dat file |
| Bellport Marina | Bellport matfile | Bellport dat file |
| Blue Point Hatchery Marina | Blue Point matfile | Blue Point dat file |
| Carmans River | Carmans River matfile | Carmans River dat file |
| Islip Hatchery | Islip Hatchery matfile | Islip Hatchery dat file |
| Tanner Park Fishing Pier | Tanner Park matfile | Tanner Park dat file |
| USCG Fire Island Base | USCG Fire Island Inlet matfile | USCG Fire Island dat file |
| Smith Point Bridge | Smith Point matfile | |


