This used to be a feature in the old echo360 locally hosted service that we had, and now due to popular demand, it has returned.
Heat Maps are visual indicators that show the instructor what parts of the classroom recording the students are watching the most.
To look at your heat map for a specific video, you would want to login to echo360.org, then go to your content, find a video you are interested in and clicking on it to open the details page. 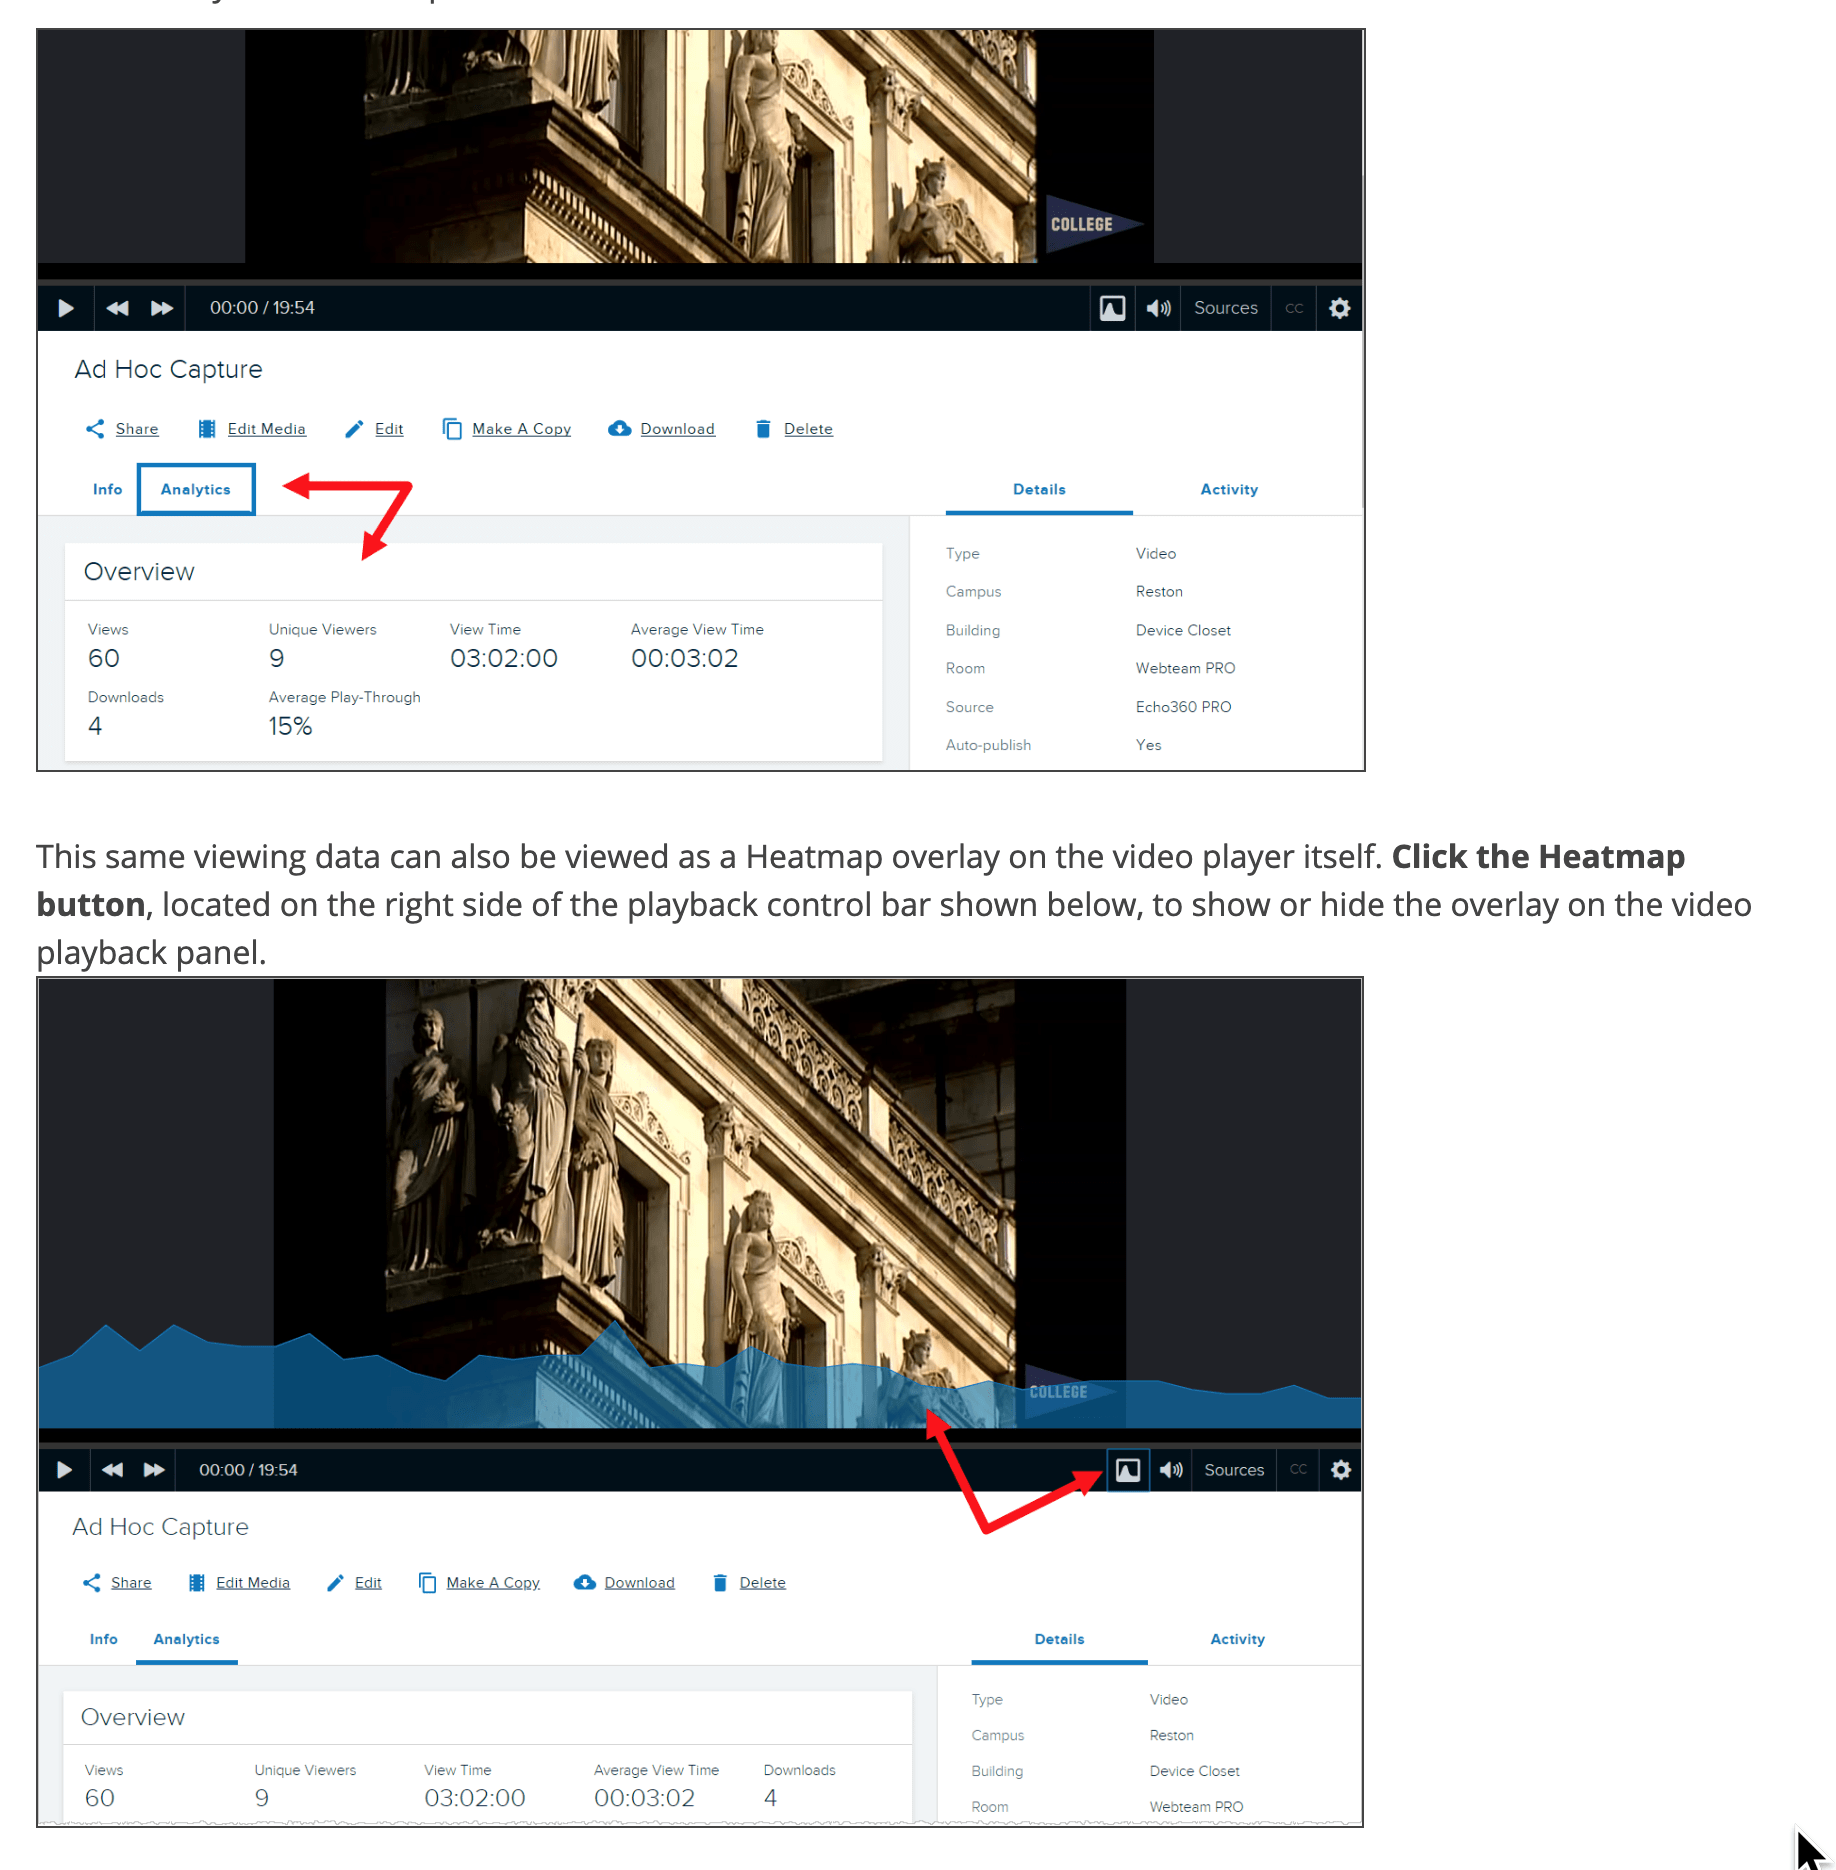
You can lay the heat map on top of the video by clicking on the button in the bottom right as seen above. The higher the graph spikes upwards, the more students watched that particular part of the video.